obspy.realtime.rttrace.RtTrace.plot
- RtTrace.plot(**kwargs)
Create a simple graph of the current trace.
Various options are available to change the appearance of the waveform plot. Please see
plot()method for all possible options.Example
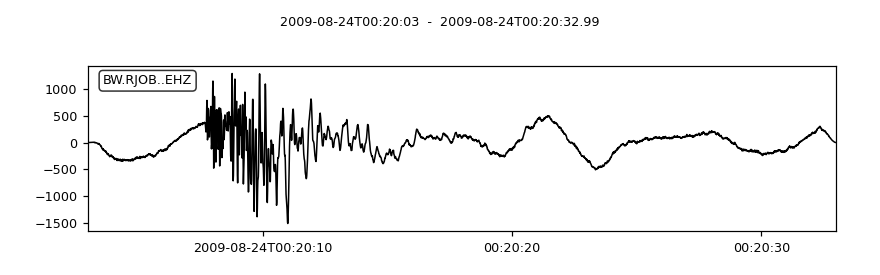
>>> from obspy import read
>>> st = read()
>>> tr = st[0]
>>> tr.plot()
(Source code, png)