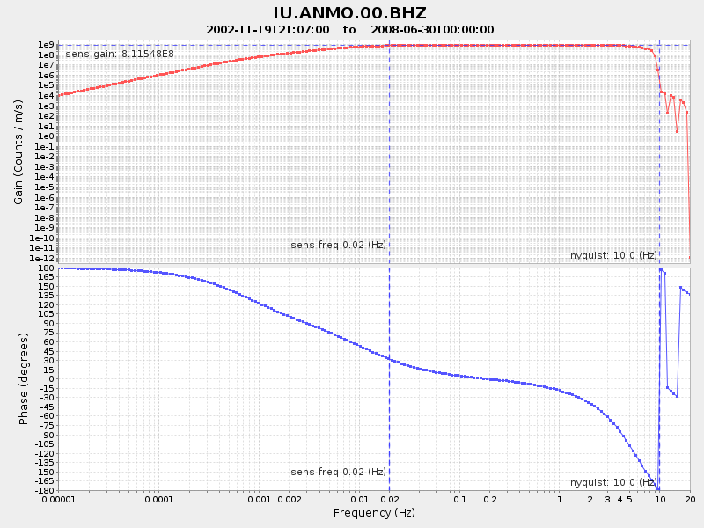
obspy.clients.iris.client.Client.evalresp
- Client.evalresp(network, station, location, channel, time=UTCDateTime(2020, 3, 7, 5, 14, 20, 298292), minfreq=1e-05, maxfreq=None, nfreq=200, units='def', width=800, height=600, annotate=True, output='plot', filename=None, **kwargs)[source]
Low-level interface for evalresp Web service of IRIS (http://service.iris.edu/irisws/evalresp/) - release 1.0.0 (2011-08-11).
This method evaluates instrument response information stored at the IRIS DMC and outputs ASCII data or Bode Plots.
Parameters: - network (str) Network code, e.g. 'IU'.
- station (str) Station code, e.g. 'ANMO'.
- location (str) Location code, e.g. '00'. Use '--' for empty location codes.
- channel (str) Channel code, e.g. 'BHZ'.
- time (UTCDateTime) Evaluate the response at the given time. If not specified, the current time is used.
- minfreq (float, optional) The minimum frequency (Hz) at which response will be evaluated. Must be positive and less than the maxfreq value. Defaults to 0.00001 Hz (1/day ~ 0.000012 Hz).
- maxfreq (float, optional) The maximum frequency (Hz) at which response will be evaluated. Must be positive and greater than the minfreq value. Defaults to the channel sample-rate or the frequency of sensitivity, which ever is larger.
- nfreq (int, optional) Number frequencies at which response will be evaluated. Must be a positive integer no greater than 10000. The instrument response is evaluated on a equally spaced logarithmic scale. Defaults to 200.
- units (str, optional)
Output Unit. Defaults to 'def'.
- 'def'
- default units indicated in response metadata
- 'dis'
- converts to units of displacement
- 'vel'
- converts to units of velocity
- 'acc'
- converts to units of acceleration
If units are not specified, then the units will default to those indicated in the response metadata
- width (int, optional) The width of the generated plot. Defaults to 800. Can only be used with the output='plot', output='plot-amp' and output='plot-phase' options. Cannot be larger than 5000 and the product of width and height cannot be larger than 6,000,000.
- height (int, optional) The height of the generated plot. Defaults to 600. Can only be used with the output='plot', output='plot-amp' and output='plot-phase' options. Cannot be larger than 5000 and the product of width and height cannot be larger than 6,000,000.
- annotate (bool, optional)
Can be either True or False. Defaults to True.
- Draws vertical lines at the Nyquist frequency (one half the sample rate).
- Draw a vertical line at the stage-zero frequency of sensitivity.
- Draws a horizontal line at the stage-zero gain.
Can only be used with the output='plot', output='plot-amp' and output='plot-phase' options.
- output (str)
Output Options. Defaults to 'plot'.
- 'fap'
- Three column ASCII (frequency, amplitude, phase)
- 'cs'
- Three column ASCII (frequency, real, imaginary)
- 'plot'
- Amplitude and phase plot
- 'plot-amp'
- Amplitude only plot
- 'plot-phase'
- Phase only plot
Plots are stored to the file system if the parameter filename is set, otherwise it will try to use matplotlib to directly plot the returned image.
- filename (str, optional) Name of a output file. If this parameter is given nothing will be returned. Default is None.
Return type: numpy.ndarray, str or None
Returns: Returns either a NumPy ndarray, image string or nothing, depending on the output parameter.
Examples
Returning frequency, amplitude, phase of first point.
>>> from obspy.clients.iris import Client
>>> client = Client()
>>> dt = UTCDateTime("2005-01-01")
>>> data = client.evalresp("IU", "ANMO", "00", "BHZ", dt,
...                        output='fap')
>>> data[0]  # frequency, amplitude, phase of first point
array([  1.00000000e-05,   1.05599900e+04,   1.79200700e+02])
Returning amplitude and phase plot.
>>> from obspy.clients.iris import Client
>>> client = Client()
>>> dt = UTCDateTime("2005-01-01")
>>> client.evalresp("IU", "ANMO", "00", "BHZ", dt)
(Source code, png, hires.png)
