obspy.core.stream.Stream.plot
- Stream.plot(*args, **kwargs)[source]
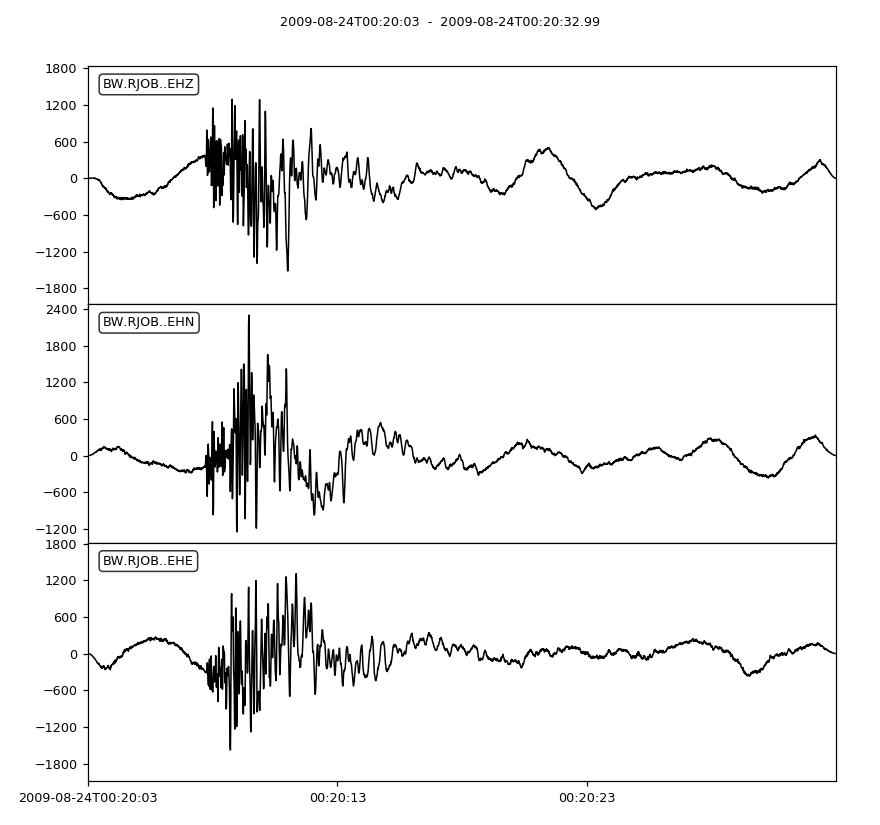
Create a waveform plot of the current ObsPy Stream object.
Parameters: - outfile Output file string. Also used to automatically determine the output format. Supported file formats depend on your matplotlib backend. Most backends support png, pdf, ps, eps and svg. Defaults to None.
- format Format of the graph picture. If no format is given the outfile parameter will be used to try to automatically determine the output format. If no format is found it defaults to png output. If no outfile is specified but a format is, than a binary imagestring will be returned. Defaults to None.
- starttime Start time of the graph as a UTCDateTime object. If not set the graph will be plotted from the beginning. Defaults to None.
- endtime End time of the graph as a UTCDateTime object. If not set the graph will be plotted until the end. Defaults to None.
- fig Use an existing matplotlib figure instance. Defaults to None.
- automerge If automerge is True, Traces with the same id will be merged. Defaults to True.
- size Size tuple in pixel for the output file. This corresponds to the resolution of the graph for vector formats. Defaults to (800, 250) pixel per channel for type='normal' or type='relative', (800, 600) for type='dayplot', and (1000, 600) for type='section'.
- dpi Dots per inch of the output file. This also affects the size of most elements in the graph (text, linewidth, ...). Defaults to 100.
- color Color of the graph as a matplotlib color string as described below. If type='dayplot' a list/tuple of color strings is expected that will be periodically repeated for each line plotted. If type='section' then the values 'network', 'station' or 'channel' are also accepted, and traces will be uniquely colored by the given information. Defaults to 'black' or to ('#B2000F', '#004C12', '#847200', '#0E01FF') for type='dayplot'.
- bgcolor Background color of the graph. Defaults to 'white'.
- face_color Face color of the matplotlib canvas. Defaults to 'white'.
- transparent Make all backgrounds transparent (True/False). This will override the bgcolor and face_color arguments. Defaults to False.
- number_of_ticks The number of ticks on the x-axis. Defaults to 4.
- tick_format The way the time axis is formatted. Defaults to '%H:%M:%S' or '%.2f' if type='relative'.
- tick_rotation Tick rotation in degrees. Defaults to 0.
- handle Whether or not to return the matplotlib figure instance after the plot has been created. Defaults to False.
- method By default, all traces with more than 400,000 samples will be plotted with a fast method that cannot be zoomed. Setting this argument to 'full' will straight up plot the data. This results in a potentially worse performance but the interactive matplotlib view can be used properly. Defaults to ‘fast’.
- type Type may be set to either: 'normal' to produce the standard plot; 'dayplot' to create a one-day plot for a single Trace; 'relative' to convert all date/time information to a relative scale starting the seismogram at 0 seconds; 'section' to plot all seismograms in a single coordinate system shifted according to their distance from a reference point. Defaults to 'normal'.
- equal_scale If enabled all plots are equally scaled. Defaults to True.
- show If True, show the plot interactively after plotting. This is ignored if any of outfile, format, handle, or fig are specified. Defaults to True.
- draw If True, the figure canvas is explicitly re-drawn, which ensures that existing figures are fresh. It makes no difference for figures that are not yet visible. Defaults to True.
- block If True block call to showing plot. Only works if the active matplotlib backend supports it. Defaults to True.
- linewidth Float value in points of the line width. Defaults to 1.0.
- linestyle Line style. Defaults to '-'
- grid_color Color of the grid. Defaults to 'black'.
- grid_linewidth Float value in points of the grid line width. Defaults to 0.5.
- grid_linestyle Grid line style. Defaults to ':'
Dayplot Parameters
The following parameters are only available if type='dayplot' is set.
Parameters: - vertical_scaling_range Determines how each line is scaled in its given space. Every line will be centered around its mean value and then clamped to fit its given space. This argument is the range in data units that will be used to clamp the data. If the range is smaller than the actual range, the lines’ data may overshoot to other lines which is usually a desired effect. Larger ranges will result in a vertical padding. If 0, the actual range of the data will be used and no overshooting or additional padding will occur. If None the range will be chosen to be the 99.5-percentile of the actual range - so some values will overshoot. Defaults to None.
- interval This defines the interval length in minutes for one line. Defaults to 15.
- time_offset Only used if type='dayplot'. The difference between the timezone of the data (specified with the kwarg timezone) and UTC time in hours. Will be displayed in a string. Defaults to the current offset of the system time to UTC time.
- timezone Defines the name of the user defined time scale. Will be displayed in a string together with the actual offset defined in the kwarg time_offset. Defaults to 'local time'.
- localization_dict
Enables limited localization of the dayplot through the usage of a dictionary. To change the labels to, e.g. German, use the following:
localization_dict={'time in': 'Zeit in', 'seconds': 'Sekunden',
                   'minutes': 'Minuten', 'hours': 'Stunden'}
- data_unit If given, the scale of the data will be drawn on the right hand side in the form "%f {data_unit}". The unit is supposed to be a string containing the actual unit of the data. Can be a LaTeX expression if matplotlib has been built with LaTeX support, e.g., "$\\frac{m}{s}$". Be careful to escape the backslashes, or use r-prefixed strings, e.g., r"$\\frac{m}{s}$". Defaults to None, meaning no scale is drawn.
- events
An optional list of events can be drawn on the plot if given. They will be displayed as yellow stars with optional annotations. They are given as a list of dictionaries. Each dictionary at least needs to have a “time” key, containing a UTCDateTime object with the origin time of the event. Furthermore every event can have an optional “text” key which will then be displayed as an annotation. Example:
events=[{"time": UTCDateTime(...), "text": "Event A"}, {...}]
It can also be a Catalog object. In this case each event will be annotated with its corresponding Flinn-Engdahl region and the magnitude. Events can also be automatically downloaded with the help of obspy.clients.fdsn. Just pass a dictionary with a “min_magnitude” key, e.g.
events={"min_magnitude": 5.5}
Defaults to [].
- x_labels_size Size of x labels in points or fontsize. Defaults to 8.
- y_labels_size Size of y labels in points or fontsize. Defaults to 8.
- title_size Size of the title in points or fontsize. Defaults to 10.
- subplots_adjust_left The left side of the subplots of the figure in fraction of the figure width. Defaults to 0.12.
- subplots_adjust_right The right side of the subplots of the figure in fraction of the figure width. Defaults to 0.88.
- subplots_adjust_top The top side of the subplots of the figure in fraction of the figure width. Defaults to 0.95.
- subplots_adjust_bottom The bottom side of the subplots of the figure in fraction of the figure width. Defaults to 0.1.
- right_vertical_labels Whether or not to display labels on the right side of the dayplot. Defaults to False.
- one_tick_per_line Whether or not to display one tick per line. Defaults to False.
- show_y_UTC_label Whether or not to display the Y UTC vertical label. Defaults to True.
- title The title to display on top of the plot. Defaults to self.stream[0].id.
Section Parameters
These parameters are only available if type='section' is set. To plot a record section the ObsPy header trace.stats.distance must be defined in meters (Default). Or trace.stats.coordinates.latitude & trace.stats.coordinates.longitude must be set if plotted in azimuthal distances (dist_degree=True) along with ev_coord.
Parameters: - scale (float, optional) Scale the traces width with this factor. Defaults to 1.0.
- vred (float, optional) Perform velocity reduction, in m/s.
- norm_method (str, optional) Defines how the traces are normalized, either against each trace or against the global maximum stream. Defaults to trace.
- offset_min (float or None, optional) Minimum offset in meters to plot. Defaults to minimum offset of all traces.
- offset_max (float or None, optional) Maximum offset in meters to plot. Defaults to maximum offset of all traces.
- dist_degree (bool, optional) Plot trace distance in degree from epicenter. If True, parameter ev_coord has to be defined. Defaults to False.
- ev_coord (tuple or None, optional) Event’s coordinates as tuple (latitude, longitude).
- plot_dx (int, optional) Spacing of ticks on the spatial x-axis. Either m or degree, depending on dist_degree.
- recordstart (int or float, optional) Seconds to crop from the beginning.
- recordlength (int or float, optional) Length of the record section in seconds.
- alpha (float, optional) Transparency of the traces between 0.0 - 1.0. Defaults to 0.5.
- time_down (bool, optional) Flip the plot horizontally, time goes down. Defaults to False, i.e., time goes up.
- reftime (UTCDateTime, optional) The reference time to which the time scale will refer. Defaults to the minimum start time of the visible traces.
- orientation (str, optional) The orientation of the time axis, either 'vertical' or 'horizontal'. Defaults to 'vertical'.
- fillcolors (tuple, optional) Fill the inside of the lines (wiggle plot), for both the positive and negative sides; use None to omit one of the sides. Defaults to (None,None).
Relative Parameters
The following parameters are only available if type='relative' is set.
Parameters: reftime (UTCDateTime, optional) The reference time to which the relative scale will refer. Defaults to starttime. Color Options
Colors can be specified as defined in the matplotlib.colors documentation.
Short Version: For all color values, you can either use:
- legal HTML color names, e.g. 'blue',
- HTML hex strings, e.g. '#EE00FF',
- pass an string of a R, G, B tuple, where each of the components is a float value in the range of 0 to 1, e.g. '(1, 0.25, 0.5)', or
- use single letters for the basic built-in colors, such as 'b' (blue), 'g' (green), 'r' (red), 'c' (cyan), 'm' (magenta), 'y' (yellow), 'k' (black), 'w' (white).
Example
>>> from obspy import read
>>> st = read()
>>> st.plot()
(Source code, png, hires.png)