obspy.signal.tf_misfit.plot_tf_gofs
- plot_tf_gofs(st1, st2, dt=0.01, t0=0.0, fmin=1.0, fmax=10.0, nf=100, w0=6, norm='global', st2_isref=True, a=10.0, k=1.0, left=0.1, bottom=0.1, h_1=0.2, h_2=0.125, h_3=0.2, w_1=0.2, w_2=0.6, w_cb=0.01, d_cb=0.0, show=True, plot_args=['k', 'r', 'b'], ylim=0.0, clim=0.0, cmap=<matplotlib.colors.LinearSegmentedColormap object at 0x43166aac>)[source]
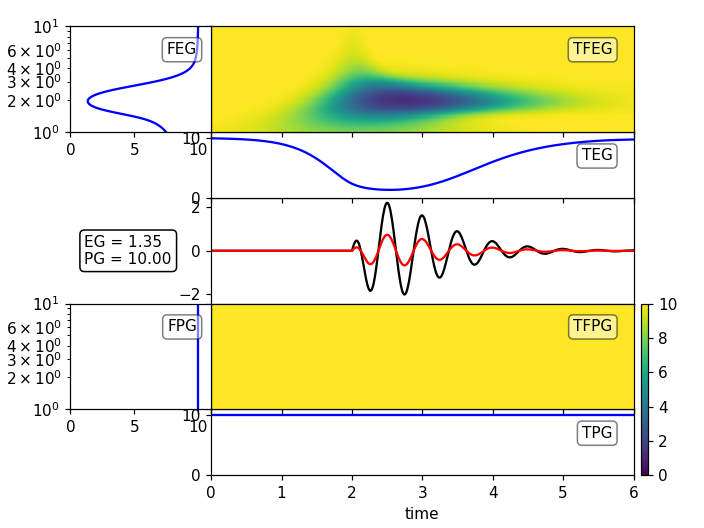
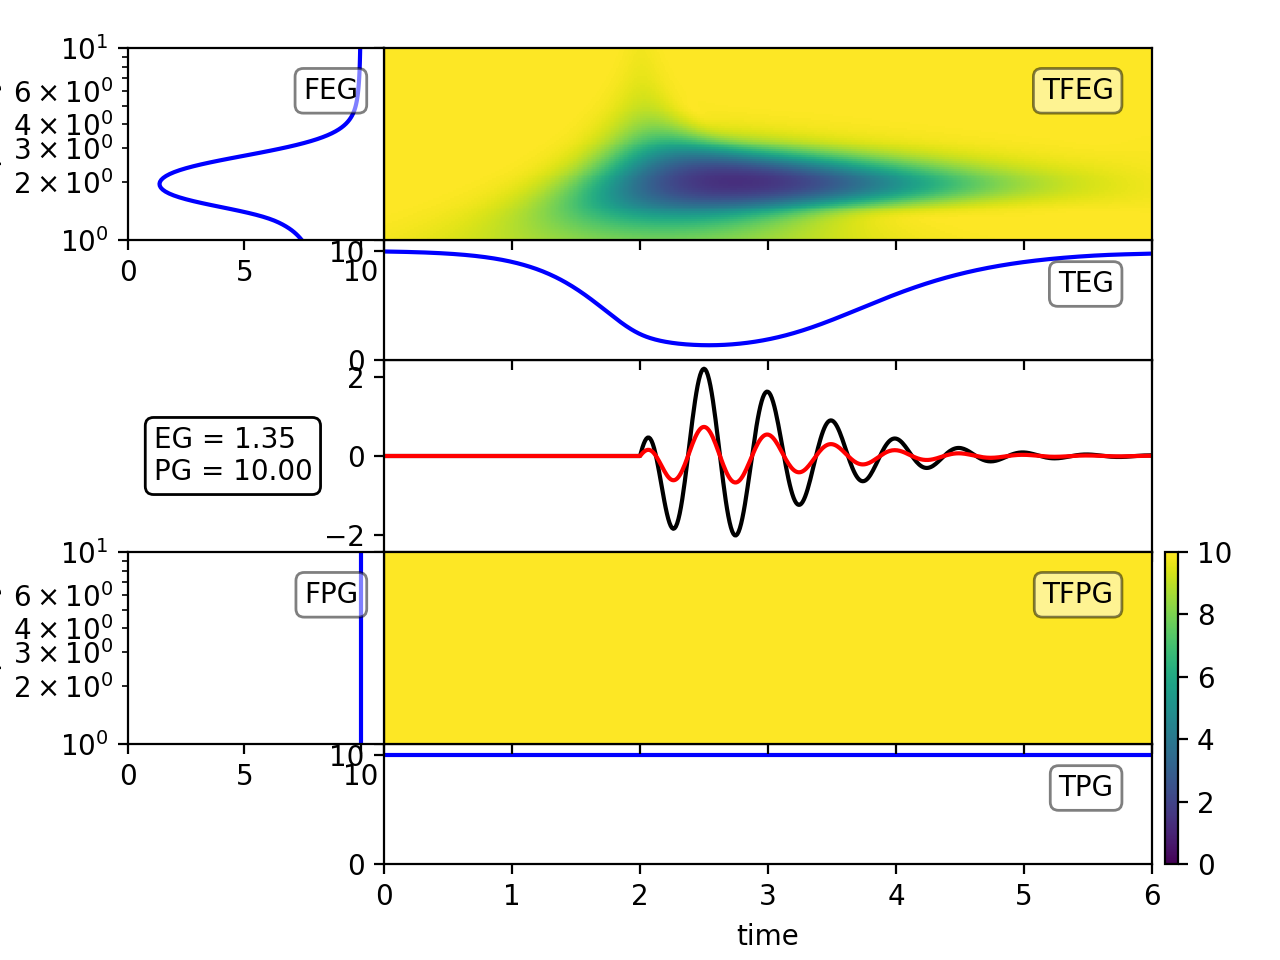
Plot all time frequency Goodness-of-Fits and the time series in one plot (per component).
Parameters: - st1 signal 1 of two signals to compare, type numpy.ndarray with shape (number of components, number of time samples) or (number of timesamples, ) for single component data
- st2 signal 2 of two signals to compare, type and shape as st1
- dt time step between two samples in st1 and st2
- t0 starting time for plotting
- fmin minimal frequency to be analyzed
- fmax maximal frequency to be analyzed
- nf number of frequencies (will be chosen with logarithmic spacing)
- w0 parameter for the wavelet, tradeoff between time and frequency resolution
- norm ‘global’ or ‘local’ normalization of the misfit
- st2_isref (bool) True if st2 is a reference signal, False if none is a reference
- A Maximum value of Goodness-of-Fit for perfect agreement
- k sensitivity of Goodness-of-Fit to the misfit
- left plot distance from the left of the figure
- bottom plot distance from the bottom of the figure
- h_1 height of the signal axes
- h_2 height of the TEM and TPM axes
- h_3 height of the TFEM and TFPM axes
- w_1 width of the FEM and FPM axes
- w_2 width of the TFEM, TFPM, signal etc. axes
- w_cb width of the colorbar axes
- d_cb distance of the colorbar axes to the other axes
- show show figure or return
- plot_args list of plot arguments passed to the signal 1/2 and TEM/TPM/FEM/FPM plots
- ylim limits in misfit for TEM/TPM/FEM/FPM
- clim limits of the colorbars
- cmap colormap for TFEM/TFPM, either a string or matplotlib.cm.Colormap instance
Returns: If show is False, returns a matplotlib.pyplot.figure object (single component data) or a list of figure objects (multi component data)
Example
For a signal with pure amplitude error
>>> import numpy as np
>>> tmax = 6.
>>> dt = 0.01
>>> npts = int(tmax / dt + 1)
>>> t = np.linspace(0., tmax, npts)
>>> A1 = 4.
>>> t1 = 2.
>>> f1 = 2.
>>> phi1 = 0.
>>> phase_shift = 0.1
>>> H1 = (np.sign(t - t1) + 1)/ 2
>>> st1 = (A1 * (t - t1) * np.exp(-2*(t - t1)) *
...       np.cos(2. * np.pi * f1 * (t - t1) + phi1 * np.pi) * H1)
>>> # Reference signal
>>> st2 = st1.copy()
>>> # Distorted signal:
>>> st1 = st1 * 3.
>>> plot_tf_gofs(st1, st2, dt=dt, fmin=1., fmax=10.)
(Source code, png, hires.png)
