obspy.core.inventory.response.Response.plot
- Response.plot(min_freq, output='VEL', start_stage=None, end_stage=None, label=None, axes=None, sampling_rate=None, unwrap_phase=False, plot_degrees=False, show=True, outfile=None)[source]
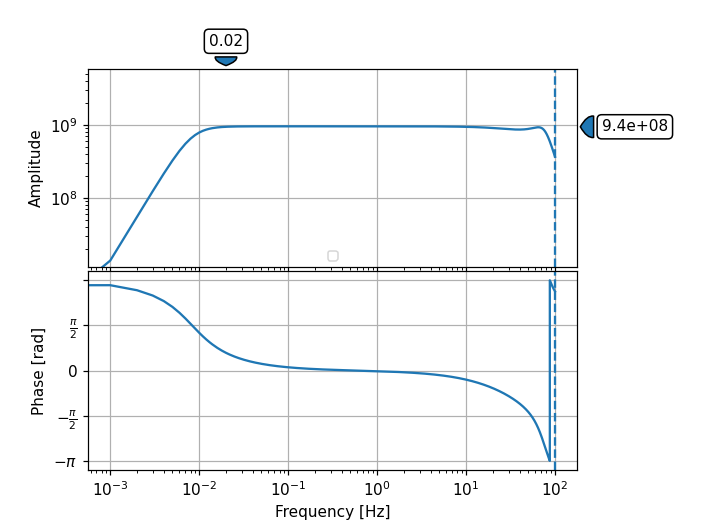
Show bode plot of instrument response.
- Parameters:
min_freq (float) – Lowest frequency to plot.
output (str) –
Output units. One of:
"DISP"displacement, output unit is meters
"VEL"velocity, output unit is meters/second
"ACC"acceleration, output unit is meters/second**2
"DEF"default units, the response is calculated in output units/input units (last stage/first stage). Useful if the units for a particular type of sensor (e.g., a pressure sensor) cannot be converted to displacement, velocity or acceleration.
start_stage (int, optional) – Stage sequence number of first stage that will be used (disregarding all earlier stages).
end_stage (int, optional) – Stage sequence number of last stage that will be used (disregarding all later stages).
label (str) – Label string for legend.
axes (list of 2
matplotlib.axes.Axes) – List/tuple of two axes instances to plot the amplitude/phase spectrum into. If not specified, a new figure is opened.sampling_rate (float) – Manually specify sampling rate of time series. If not given it is attempted to determine it from the information in the individual response stages. Does not influence the spectra calculation, if it is not known, just provide the highest frequency that should be plotted times two.
unwrap_phase (bool) – Set optional phase unwrapping using NumPy.
plot_degrees (bool) – if
Trueplot bode in degreesshow (bool) – Whether to show the figure after plotting or not. Can be used to do further customization of the plot before showing it.
outfile (str) – Output file path to directly save the resulting image (e.g.
"/tmp/image.png"). Overrides theshowoption, image will not be displayed interactively. The given path/filename is also used to automatically determine the output format. Supported file formats depend on your matplotlib backend. Most backends support png, pdf, ps, eps and svg. Defaults toNone.
Basic Usage
>>> from obspy import read_inventory
>>> resp = read_inventory()[0][0][0].response
>>> resp.plot(0.001, output="VEL")
(Source code, png)
