obspy.taup.tau.plot_ray_paths
- plot_ray_paths(source_depth, min_degrees=0, max_degrees=360, npoints=10, plot_type='spherical', phase_list=['P', 'S', 'PP'], model='iasp91', plot_all=True, legend=False, label_arrivals=False, verbose=False, fig=None, show=True, ax=None)[source]
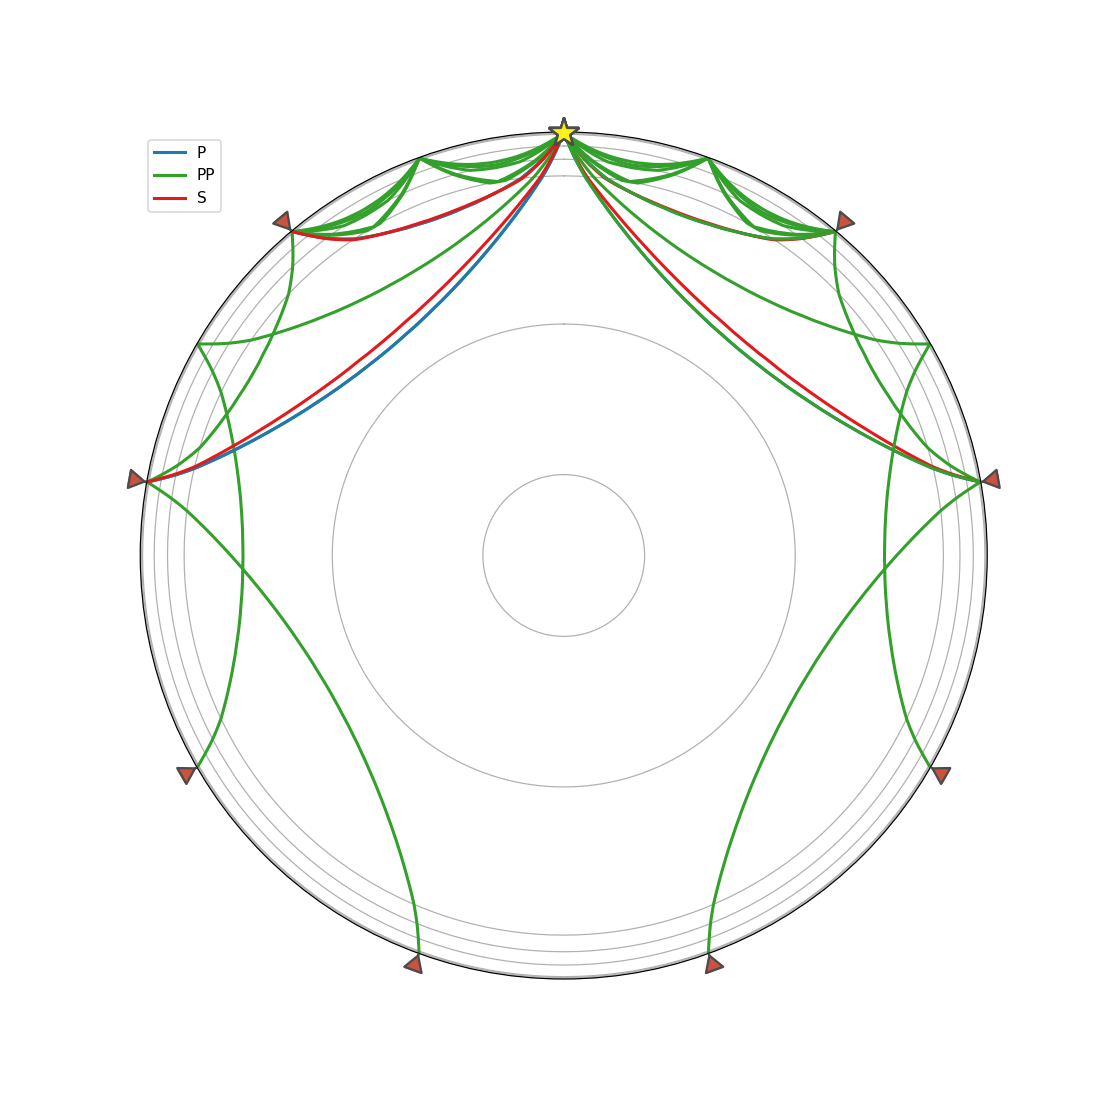
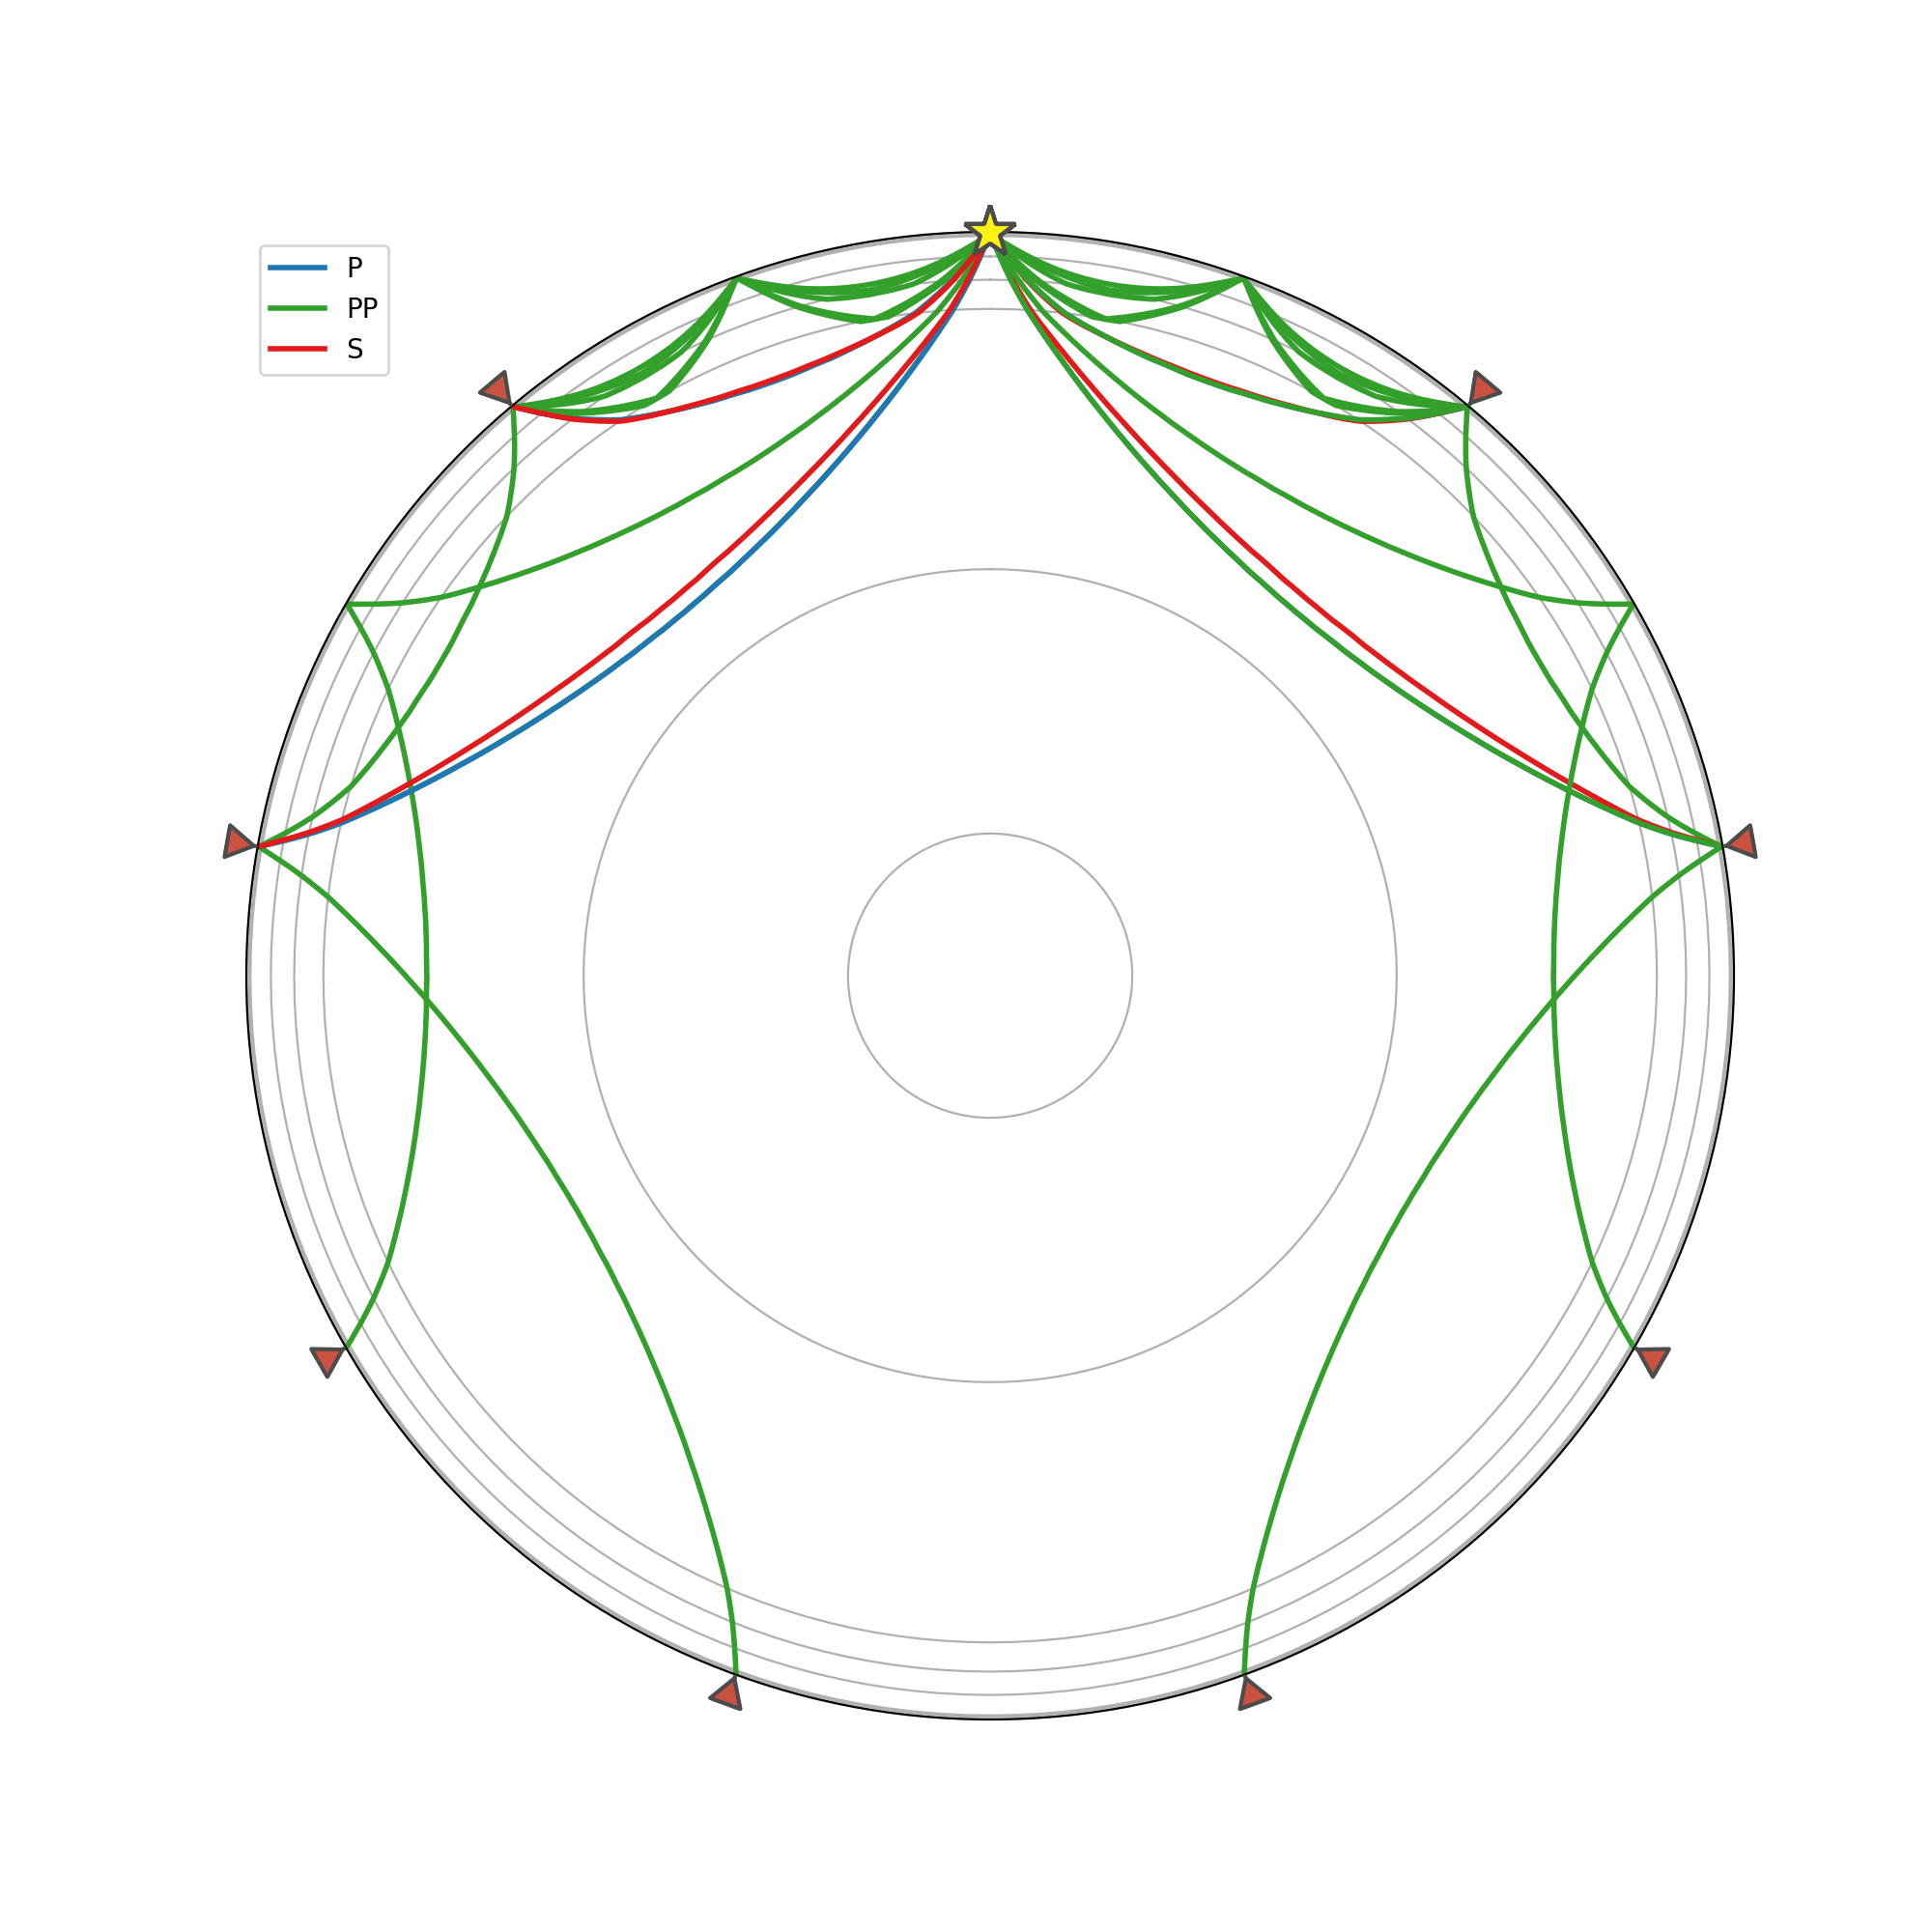
Plot ray paths for seismic phases.
Parameters: - source_depth (float) Source depth in kilometers.
- min_degrees (float) minimum distance from the source (in degrees).
- max_degrees (float) maximum distance from the source (in degrees).
- npoints (int) Number of receivers to plot.
- plot_type (str) type of plot to create. Options are ‘spherical’ (default) and ‘cartesian’.
- phase_list (list of str) List of phase names.
- model (str) Model name.
- plot_all (bool) By default all rays, even those travelling in the other direction and thus arriving at a distance of 360 - x degrees are shown. Set this to False to only show rays arriving at exactly x degrees.
- legend (bool) Whether or not to show the legend
- label_arrivals (bool) Label the arrivals with their respective phase names. This setting is only useful if you are plotting a single phase as otherwise the names could be large and possibly overlap or clip. Consider using the legend parameter instead if you are plotting multiple phases.
- verbose (bool) Whether to print information about selected phases that were not encountered at individual epicentral distances.
- fig (matplotlib.figure.Figure) Figure to plot into. If not given, a new figure instance will be created.
- show (bool) Show the plot.
- ax (matplotlib.axes.Axes) Axes to plot in. If not given, a new figure with an axes will be created.
Returns: Matplotlib axes with the plot
Return type: Example
>>> from obspy.taup import plot_ray_paths
>>> import matplotlib.pyplot as plt
>>> fig, ax = plt.subplots(figsize=(10, 10), subplot_kw=dict(polar=True))
>>> ax = plot_ray_paths(source_depth=10, ax=ax, fig=fig, legend=True,
...                     phase_list=['P', 'S', 'PP'], verbose=True)
There were rays for all but the following epicentral distances:
 [0.0, 360.0]
(Source code, png, hires.png)