Visualize Data Availability of Local Waveform Archive
Often, you have a bunch of data and want to know which station is available at
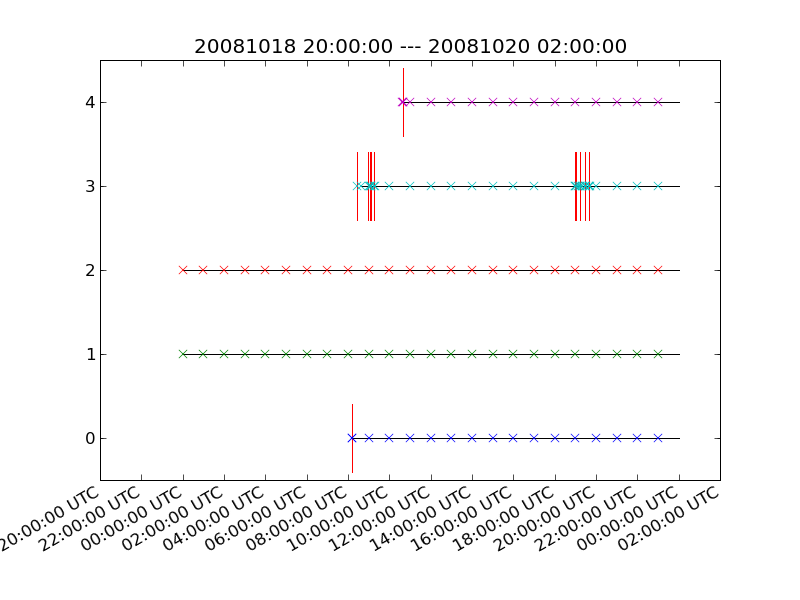
what time. For this purpose, ObsPy ships the obspy-scan script
(automatically available after installation), which detects the file format
(MiniSEED, SAC, SACXY, GSE2, SH-ASC, SH-Q, SEISAN, etc.) from the header of the
data files. Gaps are plotted as vertical red lines, start times of available
data are plotted as crosses - the data itself are plotted as horizontal lines.
The script can be used to scan through 1000s of files (already used with 30000 files, execution time ca. 45min), month/year ranges are plotted automatically. It opens an interactive plot in which you can zoom in …
Execute something like following line from the command prompt, use e.g. wildcards to match the files:
$ obspy-scan /bay_mobil/mobil/20090622/1081019/*_1.*