obspy.signal.tf_misfit.plot_tfr
- plot_tfr(st, dt=0.01, t0=0.0, fmin=1.0, fmax=10.0, nf=100, w0=6, left=0.1, bottom=0.1, h_1=0.2, h_2=0.6, w_1=0.2, w_2=0.6, w_cb=0.01, d_cb=0.0, show=True, plot_args=['k', 'k'], clim=0.0, cmap=<matplotlib.colors.LinearSegmentedColormap object>, mode='absolute', fft_zero_pad_fac=0)[source]
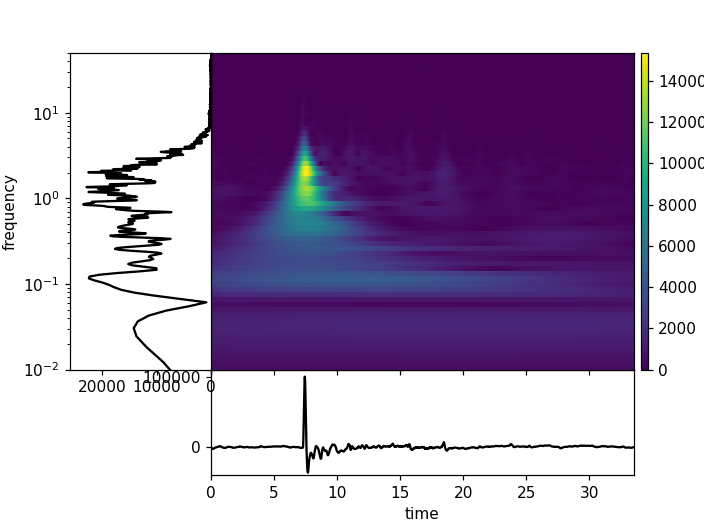
Plot time frequency representation, spectrum and time series of the signal.
- Parameters:
st – signal, type numpy.ndarray with shape (number of components, number of time samples) or (number of timesamples, ) for single component data
dt – time step between two samples in st
t0 – starting time for plotting
fmin – minimal frequency to be analyzed
fmax – maximal frequency to be analyzed
nf – number of frequencies (will be chosen with logarithmic spacing)
w0 – parameter for the wavelet, tradeoff between time and frequency resolution
left – plot distance from the left of the figure
bottom – plot distance from the bottom of the figure
h_1 – height of the signal axis
h_2 – height of the TFR/spectrum axis
w_1 – width of the spectrum axis
w_2 – width of the TFR/signal axes
w_cb – width of the colorbar axes
d_cb – distance of the colorbar axes to the other axes
show – show figure or return
plot_args – list of plot arguments passed to the signal and spectrum plots
clim – limits of the colorbars
cmap – colormap for TFEM/TFPM, either a string or matplotlib.cm.Colormap instance
mode – ‘absolute’ for absolute value of TFR, ‘power’ for
|TFR|^2fft_zero_pad_fac – integer, if > 0, the signal is zero padded to
nfft = next_pow_2(len(st)) * fft_zero_pad_facto get smoother spectrum in the low frequencies (has no effect on the TFR and might make demeaning/tapering necessary to avoid artifacts)
- Returns:
If show is False, returns a matplotlib.pyplot.figure object (single component data) or a list of figure objects (multi component data)
Example
>>> from obspy import read
>>> tr = read("https://examples.obspy.org/a02i.2008.240.mseed")[0]
>>> plot_tfr(tr.data, dt=tr.stats.delta, fmin=.01,
...         fmax=50., w0=8., nf=64, fft_zero_pad_fac=4)
(Source code, png)