obspy.imaging.cm
Module for ObsPy’s default colormaps.
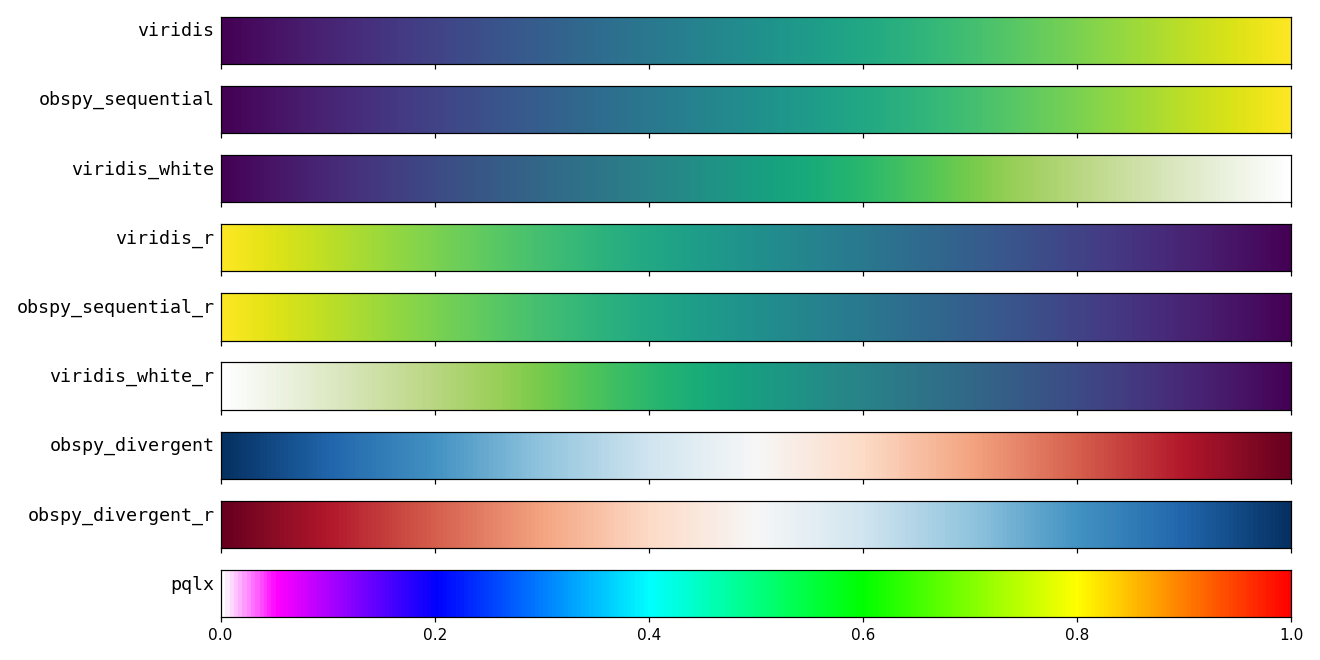
Overview of provided colormaps:
The following colormaps can be imported like..
>>> from obspy.imaging.cm import viridis_r
List of all colormaps:
(Source code, png)
viridis
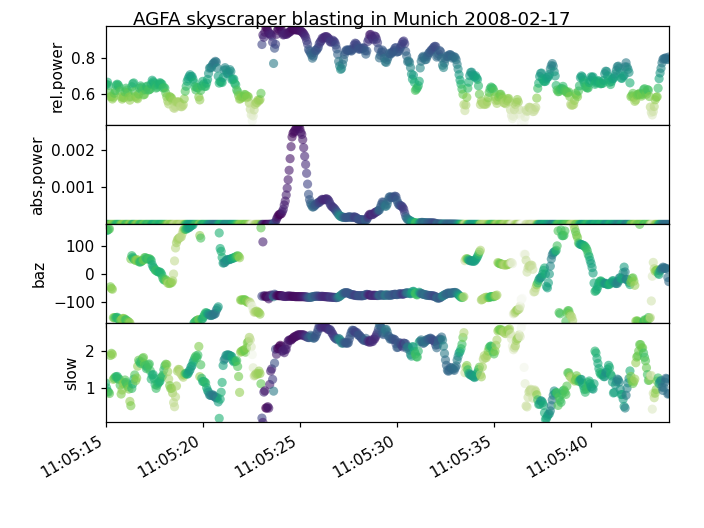
“viridis” is matplotlib’s new default colormap from version 2.0 onwards and is based on a design by Eric Firing (@efiring, see http://thread.gmane.org/gmane.comp.python.matplotlib.devel/13522/focus=13542).
>>> from obspy.imaging.cm import viridis
(Source code, png)
(Source code, png)
(Source code, png)
(Source code, png)
(Source code, png)
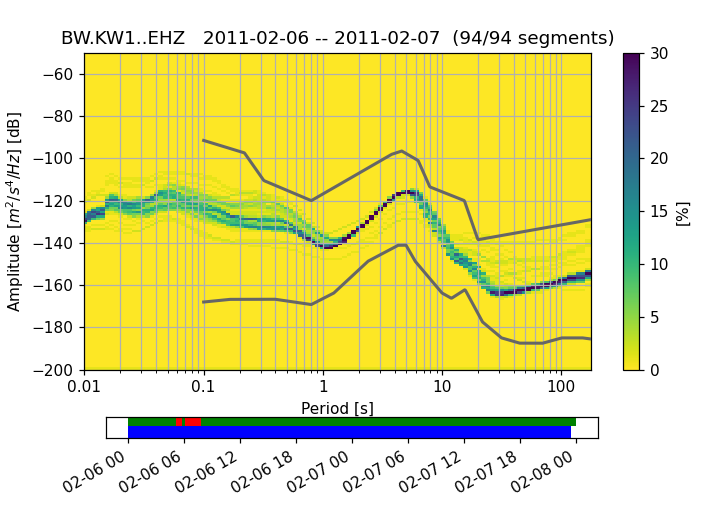
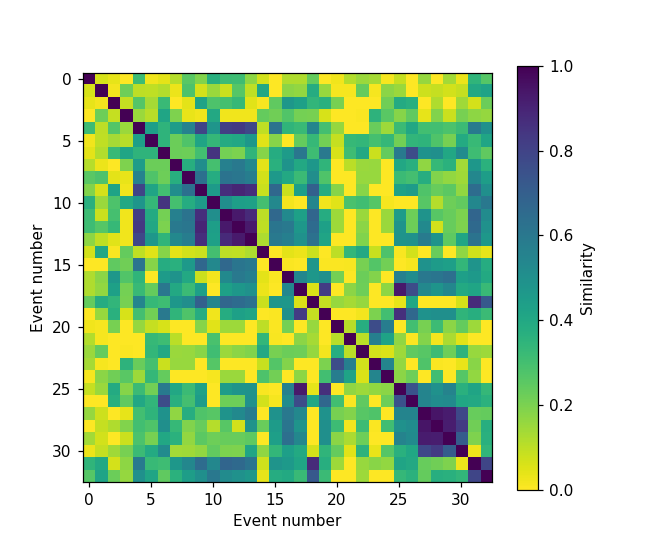
viridis_r
Reversed version of viridis.
>>> from obspy.imaging.cm import viridis_r
(Source code, png)
(Source code, png)
(Source code, png)
(Source code, png)
(Source code, png)
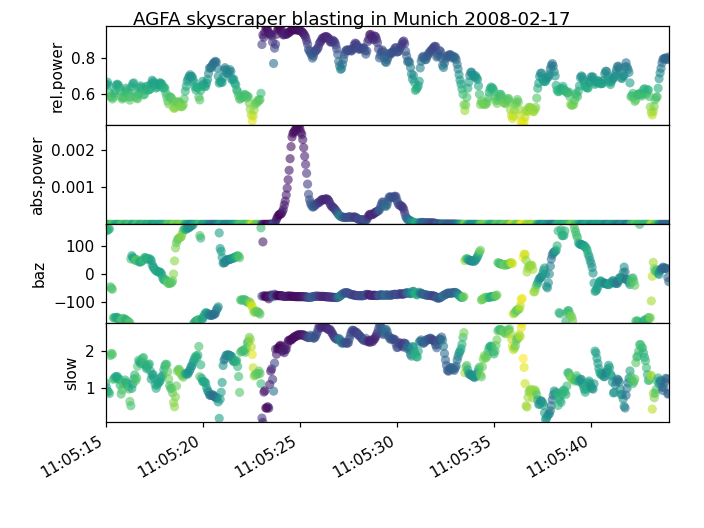
viridis_white
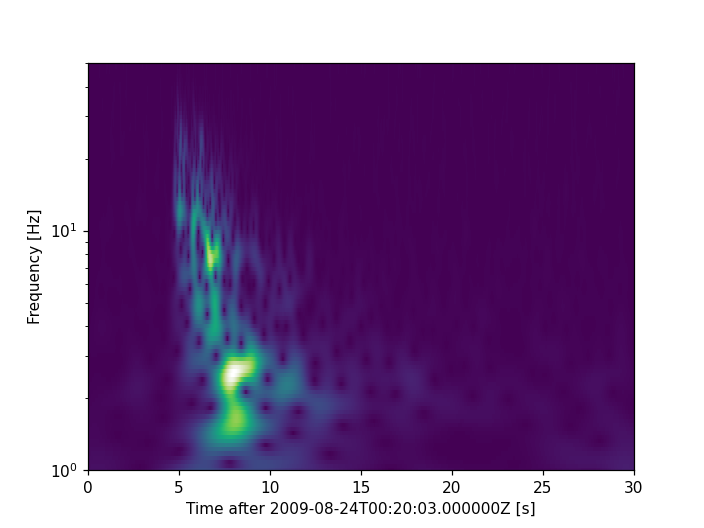
“viridis_white” is a modified version of “viridis” that goes to white instead of yellow in the end. Although it remains perceptually uniform, the light colors are a bit more difficult to distinguish than yellow in the original viridis. It is useful for printing because one end of the colorbar can merge with a white background (by M Meschede).
>>> from obspy.imaging.cm import viridis_white
(Source code, png)
(Source code, png)
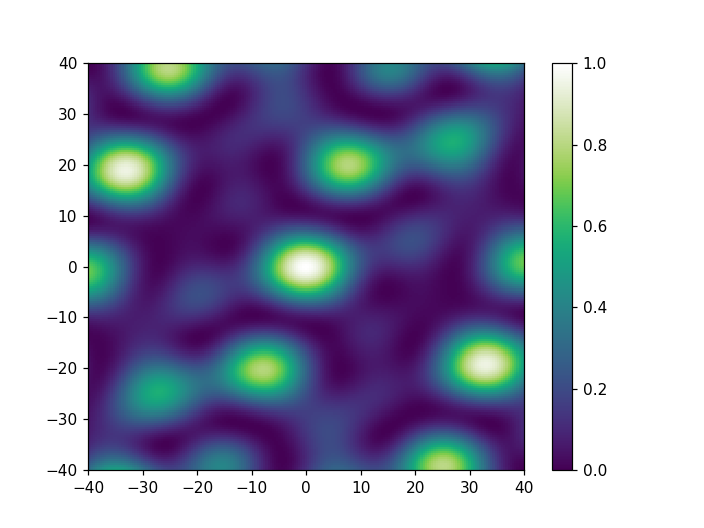
(Source code, png)
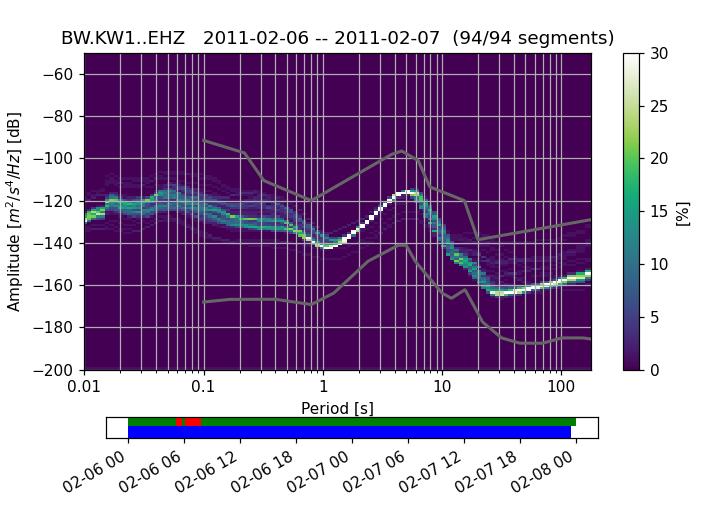
(Source code, png)
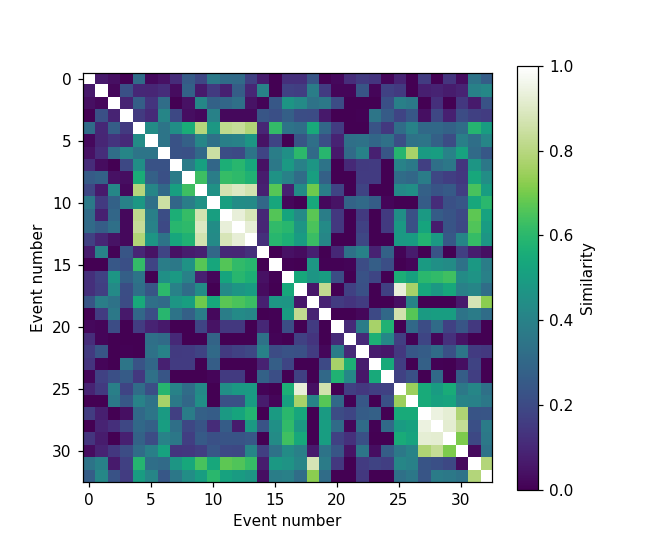
(Source code, png)
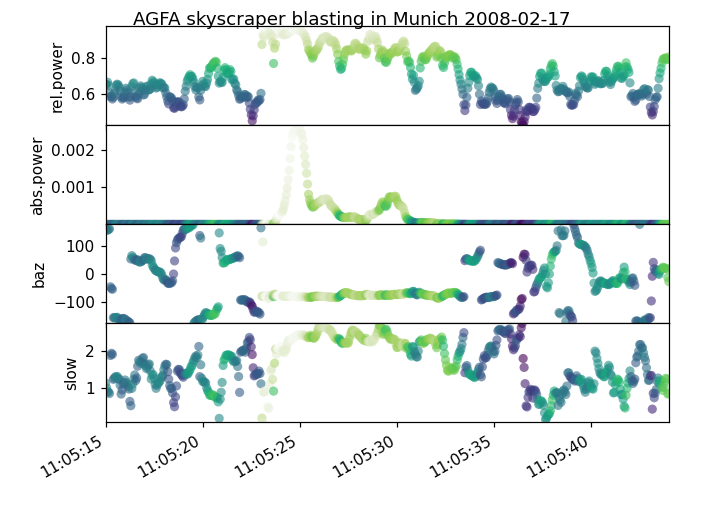
viridis_white_r
Reversed version of viridis_white.
>>> from obspy.imaging.cm import viridis_white_r
(Source code, png)
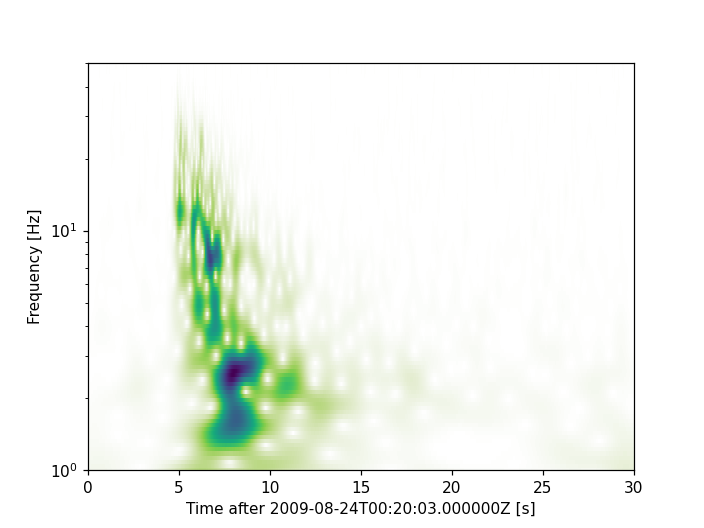
(Source code, png)
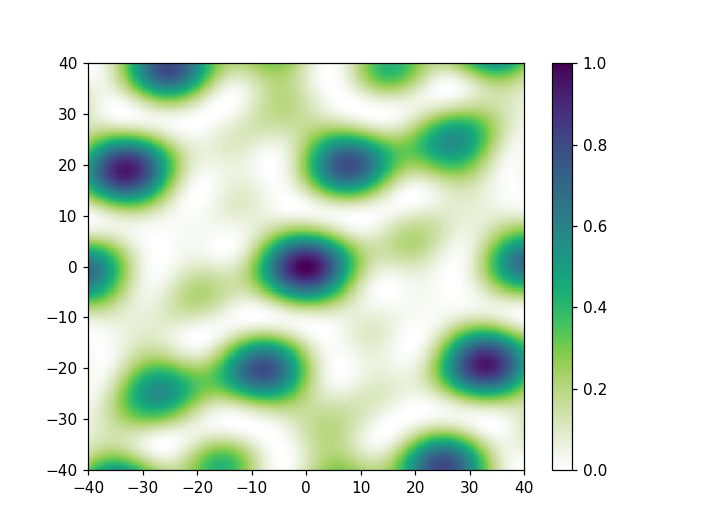
(Source code, png)
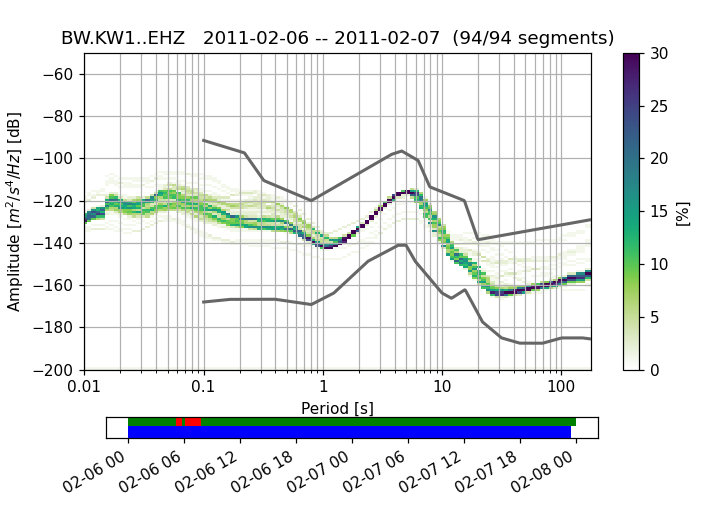
(Source code, png)
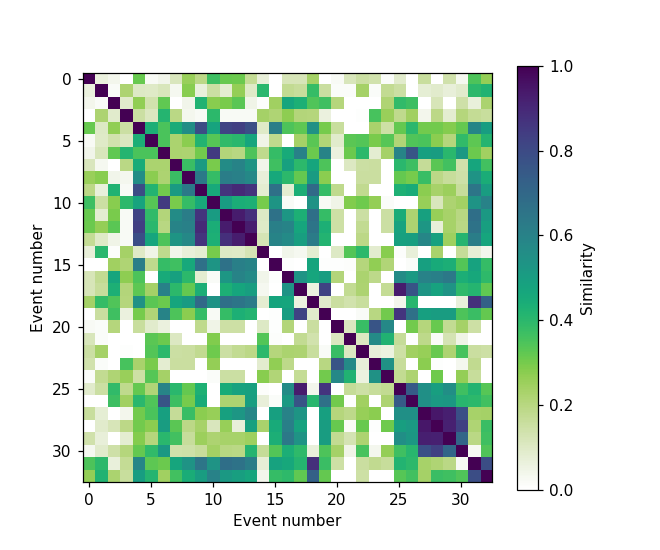
(Source code, png)
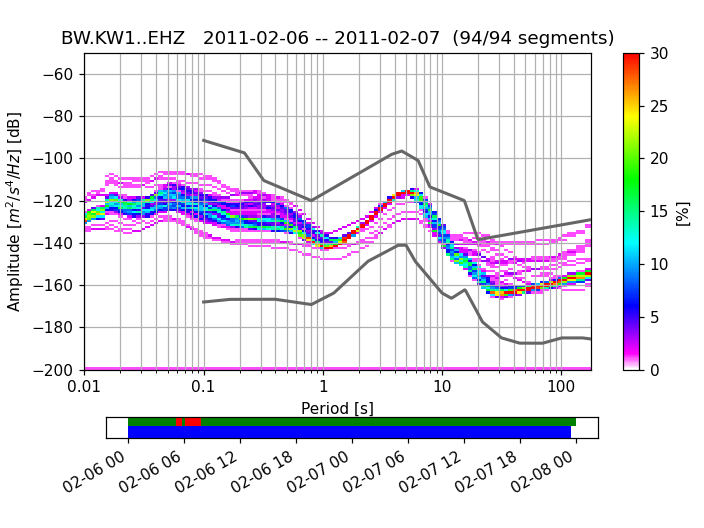
pqlx
Colormap defined and used in PQLX (see [McNamara2004]).
>>> from obspy.imaging.cm import pqlx
(Source code, png)
- copyright:
The ObsPy Development Team (devs@obspy.org)
- license:
GNU Lesser General Public License, Version 3 (https://www.gnu.org/copyleft/lesser.html)
Private Functions
Warning
Private functions are mainly for internal/developer use and their API might change without notice.
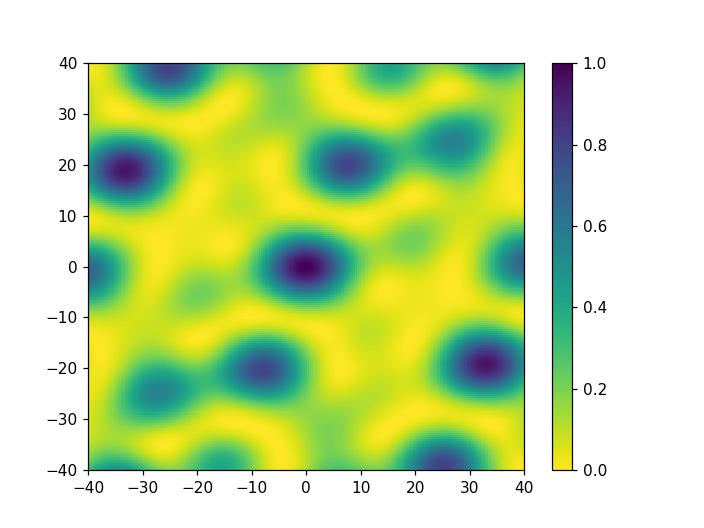
Plot for illustrating colormaps: array response. |
|
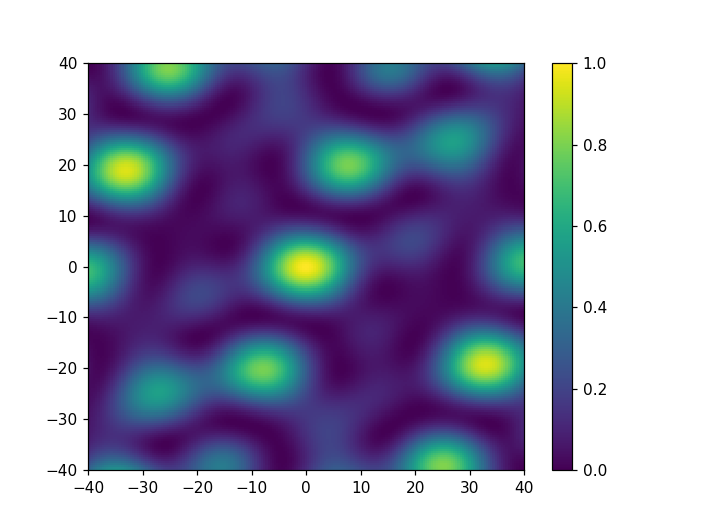
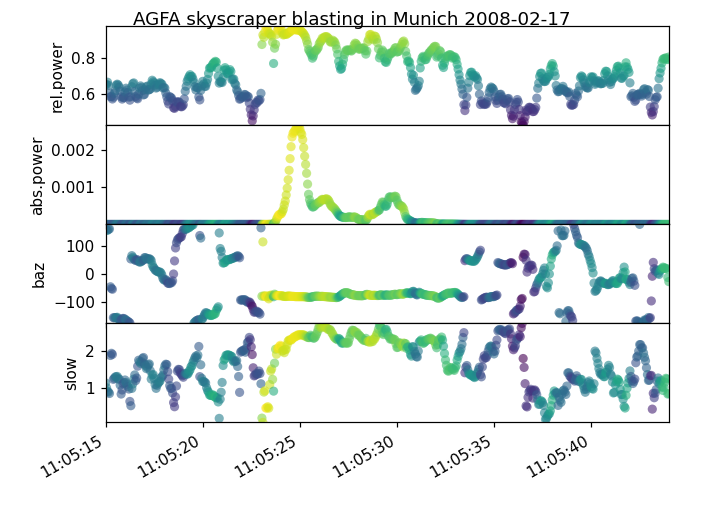
Plot for illustrating colormaps: beamforming. |
|
Plot for illustrating colormaps: beamforming. |
|
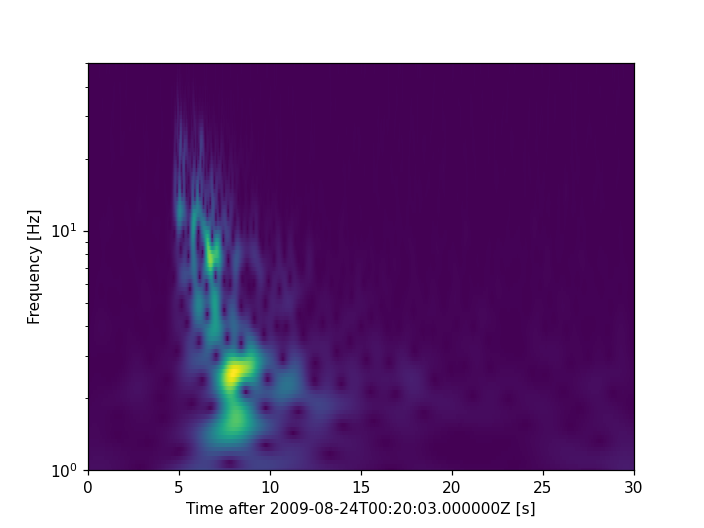
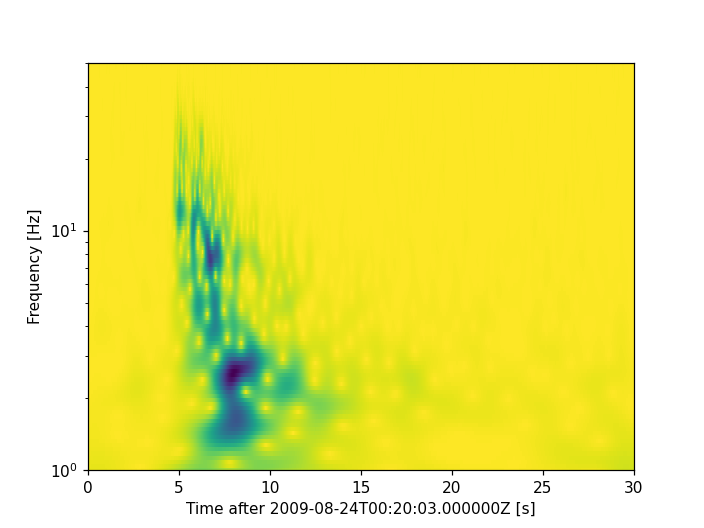
Plot for illustrating colormaps: cwt. |
|
Overview bar plot, adapted after http://scipy-cookbook.readthedocs.org/items/Matplotlib_Show_colormaps.html. |
|
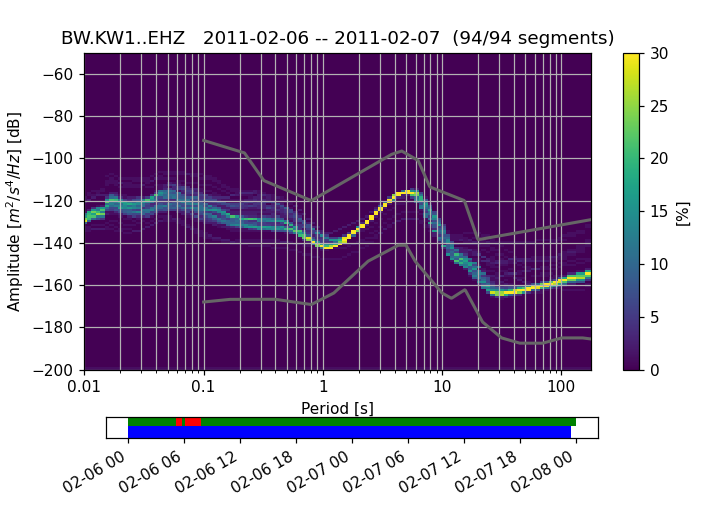
Plot for illustrating colormaps: PPSD. |
|
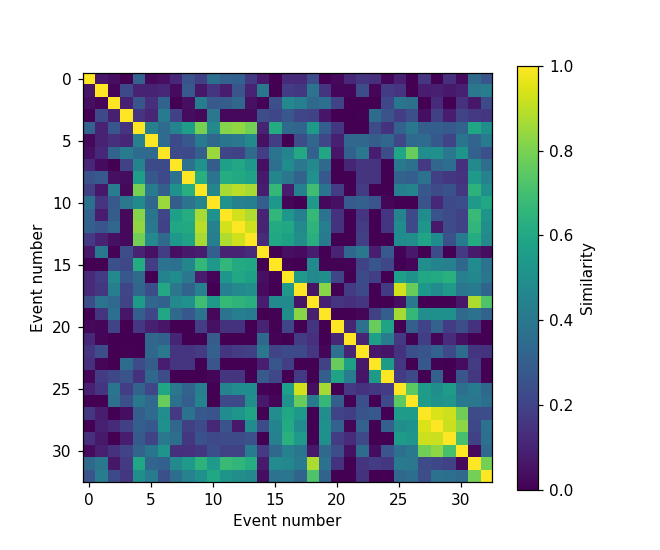
Plot for illustrating colormaps: similarity matrix. |
|
Return all colormaps in "obspy/imaging/data" directory, including reversed versions. |
|
Load a |