Cross-Correlation Pick Correction
This example shows how to align the waveforms of phase onsets of two earthquakes in order to correct the original pick times that can never be set perfectly consistent in routine analysis. A parabola is fit to the concave part of the cross correlation function around its maximum, following the approach by [Deichmann1992].
To adjust the parameters (i.e. the used time window around the pick and the filter settings) and to validate and check the results the options plot and filename can be used to open plot windows or save the figure to a file.
See the documentation of
xcorr_pick_correction() for more details.
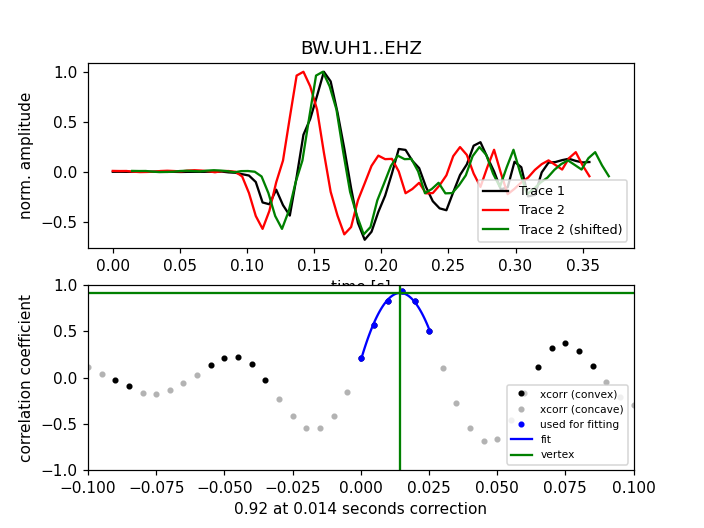
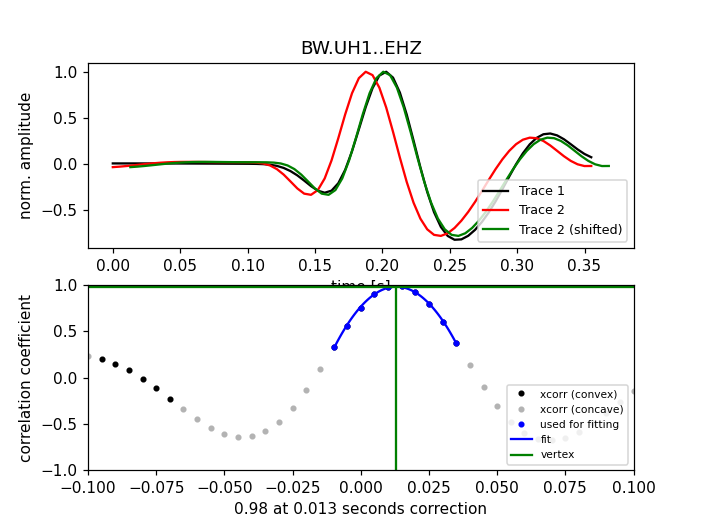
The example will print the time correction for pick 2 and the respective correlation coefficient and open a plot window for correlations on both the original and preprocessed data:
No preprocessing:
  Time correction for pick 2: -0.014459
  Correlation coefficient: 0.92
Bandpass prefiltering:
  Time correction for pick 2: -0.013025
  Correlation coefficient: 0.98
from __future__ import print_function

import obspy
from obspy.signal.cross_correlation import xcorr_pick_correction


# read example data of two small earthquakes
path = "https://examples.obspy.org/BW.UH1..EHZ.D.2010.147.%s.slist.gz"
st1 = obspy.read(path % ("a", ))
st2 = obspy.read(path % ("b", ))
# select the single traces to use in correlation.
# to avoid artifacts from preprocessing there should be some data left and
# right of the short time window actually used in the correlation.
tr1 = st1.select(component="Z")[0]
tr2 = st2.select(component="Z")[0]
# these are the original pick times set during routine analysis
t1 = obspy.UTCDateTime("2010-05-27T16:24:33.315000Z")
t2 = obspy.UTCDateTime("2010-05-27T16:27:30.585000Z")

# estimate the time correction for pick 2 without any preprocessing and open
# a plot window to visually validate the results
dt, coeff = xcorr_pick_correction(t1, tr1, t2, tr2, 0.05, 0.2, 0.1, plot=True)
print("No preprocessing:")
print("  Time correction for pick 2: %.6f" % dt)
print("  Correlation coefficient: %.2f" % coeff)
# estimate the time correction with bandpass prefiltering
dt, coeff = xcorr_pick_correction(t1, tr1, t2, tr2, 0.05, 0.2, 0.1, plot=True,
                                  filter="bandpass",
                                  filter_options={'freqmin': 1, 'freqmax': 10})
print("Bandpass prefiltering:")
print("  Time correction for pick 2: %.6f" % dt)
print("  Correlation coefficient: %.2f" % coeff)

