obspy.core.event.Event.plot
- Event.plot(kind=[['ortho', 'beachball'], ['p_sphere', 's_sphere']], subplot_size=4.0, show=True, outfile=None, **kwargs)[source]
Plot event location and/or the preferred focal mechanism and radiation pattern.
- Parameters:
kind (list[str] or list[list[str]]) –
A list of strings (for a 1-row plot) or a nested list of strings (one list of strings per row), with the following keywords to generate a matplotlib figure:
'ortho'(Orthographic plot of event location seeplot())'global'(Global plot of event location seeplot())'local'(Local plot of event location seeplot())'beachball'(Beachball of preferred focal mechanism)'p_quiver'(quiver plot of p wave farfield)'s_quiver'(quiver plot of s wave farfield)'p_sphere'(surface plot of p wave farfield)'s_sphere'(surface plot of s wave farfield)
subplot_size (float) – Width/height of one single subplot cell in inches.
show (bool) – Whether to show the figure after plotting or not. Can be used to do further customization of the plot before showing it. Has no effect if outfile is specified.
outfile (str) – Output file path to directly save the resulting image (e.g.
"/tmp/image.png"). Overrides theshowoption, image will not be displayed interactively. The given path/filename is also used to automatically determine the output format. Supported file formats depend on your matplotlib backend. Most backends support png, pdf, ps, eps and svg. Defaults toNone. The figure is closed after saving it to file.
- Returns:
Figure instance with the plot.
Examples
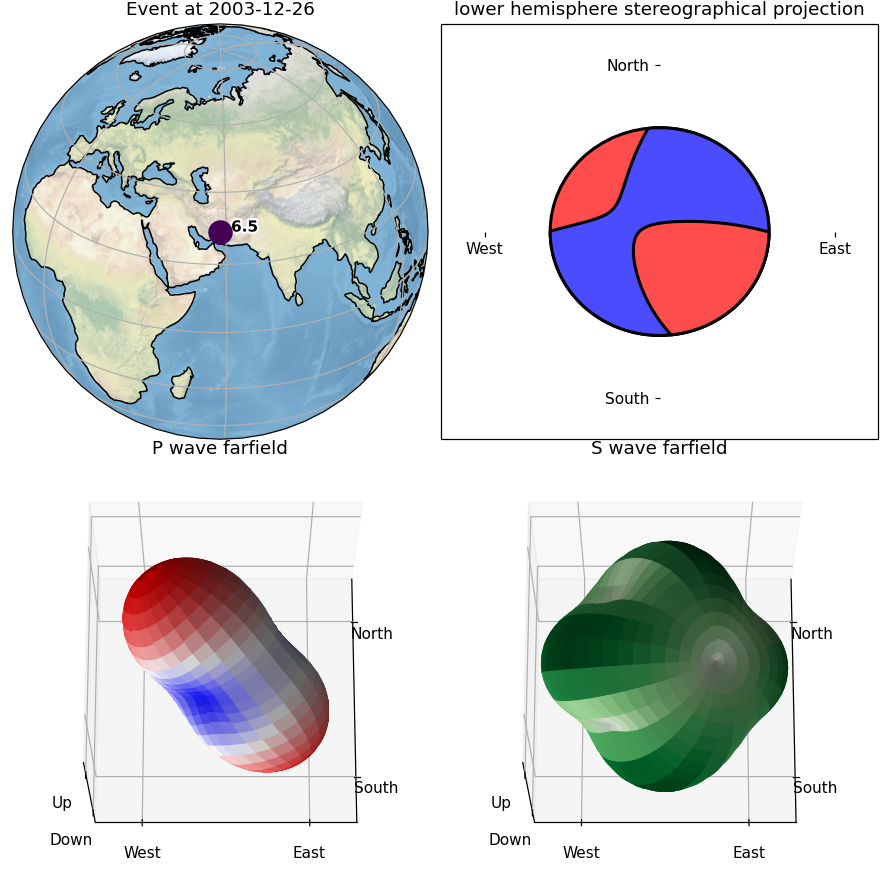
Default plot includes an orthographic map plot, a beachball plot and plots of P/S farfield radiation patterns (preferred – or first – focal mechanism has to have a moment tensor set).
>>> from obspy import read_events
>>> event = read_events("/path/to/CMTSOLUTION")[0]
>>> event.plot()
(Source code, png)
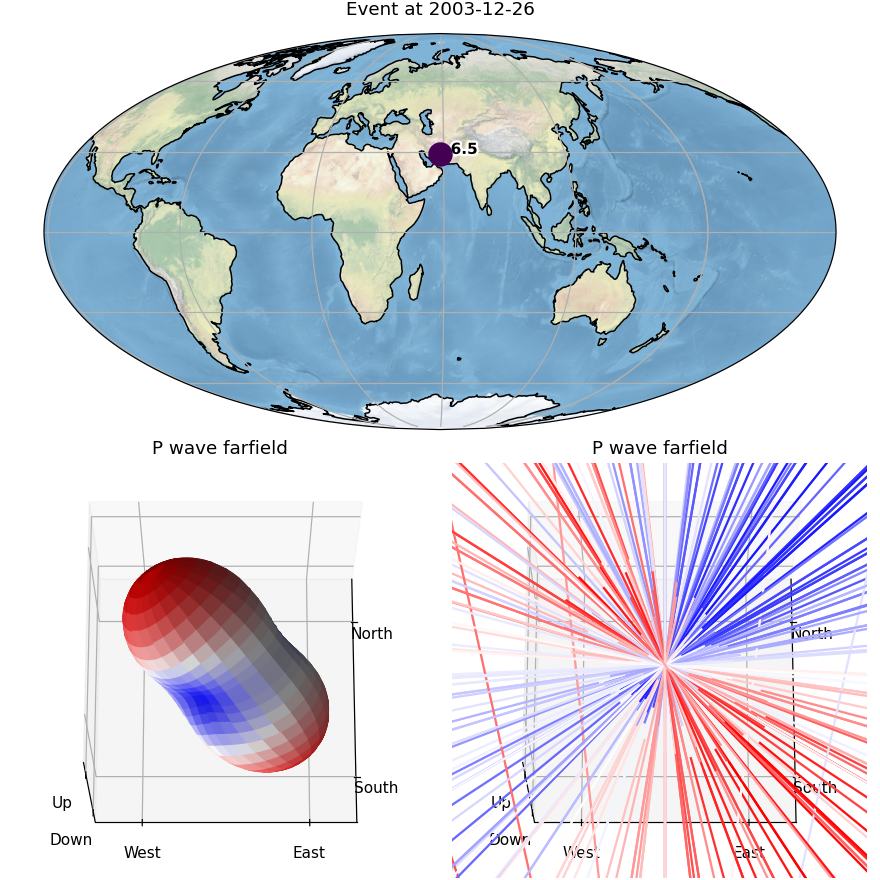
Individual subplot parts and the setup of the grid of subplots (rows/columns) can be specified by using certain keywords, see kind parameter description.
>>> event.plot(kind=[['global'],
...                  ['p_sphere', 'p_quiver']])
(Source code, png)