obspy.taup.tau.plot_travel_times
- plot_travel_times(source_depth, phase_list=('ttbasic',), min_degrees=0, max_degrees=180, npoints=None, model='iasp91', plot_all=True, legend=True, verbose=False, fig=None, ax=None, show=True)[source]
Returns a travel time plot and any created axis instance of this plot.
- Parameters:
source_depth (float) – Source depth in kilometers.
min_degrees (float) – minimum distance from the source (in degrees)
max_degrees (float) – maximum distance from the source (in degrees)
npoints (int) – Number of points to plot. If None, the precomputed times in the TauModel are shown. If an integer, arrivals are calculated at npoints discrete epicentral distances.
phase_list (list[str], optional) – List of phase names to plot.
model (str) – string containing the model to use.
plot_all (bool) – By default all rays, even those travelling in the other direction and thus arriving at a distance of 360 - x degrees are shown. Set this to
Falseto only show rays arriving at exactly x degrees.legend (bool) – Whether or not to show the legend
verbose (bool) – Whether to print information about epicentral distances that did not have an arrival.
fig (
matplotlib.figure.Figure) – Figure to plot into. If not given, a new figure instance will be created.ax (
matplotlib.axes.Axes) – Axes to plot in. If not given, a new figure with an axes will be created.show (bool) – Show the plot.
ax – Axes to plot in. If not given, a new figure with an axes will be created.
- Returns:
Matplotlib axes with the plot
- Return type:
Example
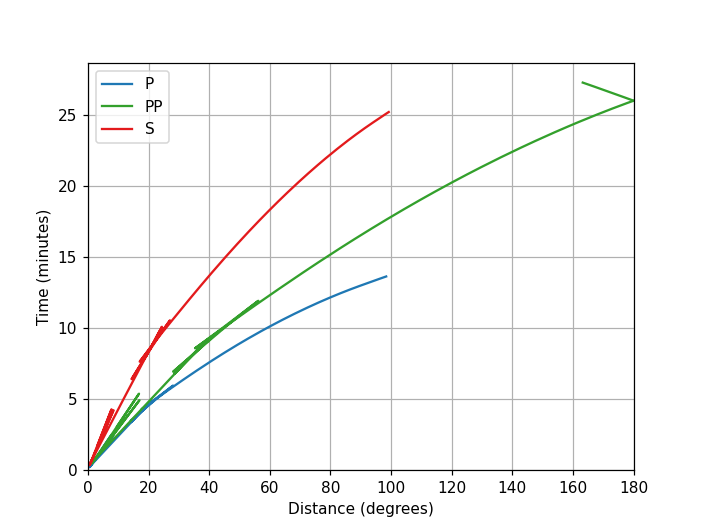
>>> from obspy.taup import plot_travel_times
>>> ax = plot_travel_times(source_depth=10, phase_list=['P', 'S', 'PP'])
(Source code, png)
