obspy.core.inventory.inventory.Inventory.plot_response
- Inventory.plot_response(min_freq, output='VEL', network='*', station='*', location='*', channel='*', time=None, starttime=None, endtime=None, axes=None, unwrap_phase=False, plot_degrees=False, show=True, outfile=None, label_epoch_dates=False)[source]
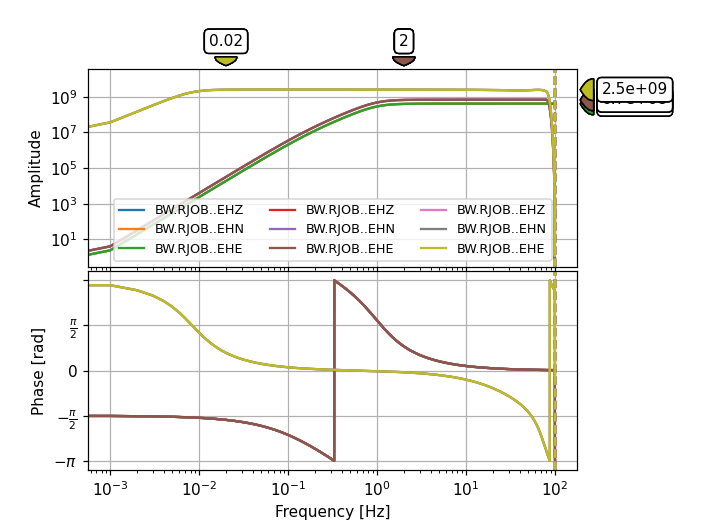
Show bode plot of instrument response of all (or a subset of) the inventory’s channels.
- Parameters:
min_freq (float) – Lowest frequency to plot.
output (str) –
Output units. One of:
"DISP"displacement, output unit is meters
"VEL"velocity, output unit is meters/second
"ACC"acceleration, output unit is meters/second**2
"DEF"default units, the response is calculated in output units/input units (last stage/first stage). Useful if the units for a particular type of sensor (e.g., a pressure sensor) cannot be converted to displacement, velocity or acceleration.
network (str) – Only plot matching networks. Accepts UNIX style patterns and wildcards (e.g.
"G*","*[ER]"; seefnmatch())station (str) – Only plot matching stations. Accepts UNIX style patterns and wildcards (e.g.
"L44*","L4?A","[LM]44A"; seefnmatch())location (str) – Only plot matching channels. Accepts UNIX style patterns and wildcards (e.g.
"BH*","BH?","*Z","[LB]HZ"; seefnmatch())channel (str) – Only plot matching channels. Accepts UNIX style patterns and wildcards (e.g.
"BH*","BH?","*Z","[LB]HZ"; seefnmatch())time (
UTCDateTime) – Only regard networks/stations/channels active at given point in time.starttime (
UTCDateTime) – Only regard networks/stations/channels active at or after given point in time (i.e. networks ending before given time will not be shown).endtime (
UTCDateTime) – Only regard networks/stations/channels active before or at given point in time (i.e. networks starting after given time will not be shown).axes (list of 2
matplotlib.axes.Axes) – List/tuple of two axes instances to plot the amplitude/phase spectrum into. If not specified, a new figure is opened.unwrap_phase (bool) – Set optional phase unwrapping using NumPy.
plot_degrees (bool) – if
Trueplot bode in degreesshow (bool) – Whether to show the figure after plotting or not. Can be used to do further customization of the plot before showing it.
outfile (str) – Output file path to directly save the resulting image (e.g.
"/tmp/image.png"). Overrides theshowoption, image will not be displayed interactively. The given path/file name is also used to automatically determine the output format. Supported file formats depend on your matplotlib backend. Most backends support png, pdf, ps, eps and svg. Defaults toNone.label_epoch_dates (bool) – Whether to add channel epoch dates in the plot’s legend labels.
Basic Usage
>>> from obspy import read_inventory
>>> inv = read_inventory()
>>> inv.plot_response(0.001, station="RJOB")
(Source code, png)