Array Response Function
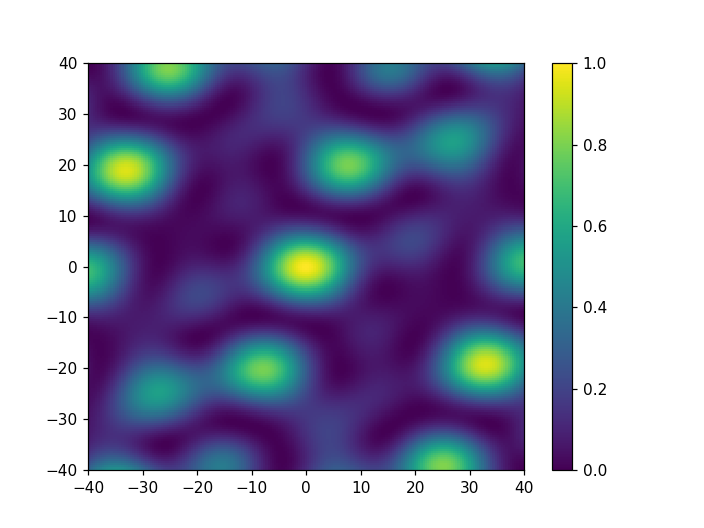
The following code block shows how to plot the array transfer function for
beam forming as a function of wavenumber using the ObsPy function
obspy.signal.array_analysis.array_transff_wavenumber().
import numpy as np
import matplotlib.pyplot as plt

from obspy.imaging.cm import obspy_sequential
from obspy.signal.array_analysis import array_transff_wavenumber


# generate array coordinates
coords = np.array([[10., 60., 0.], [200., 50., 0.], [-120., 170., 0.],
                   [-100., -150., 0.], [30., -220., 0.]])

# coordinates in km
coords /= 1000.

# set limits for wavenumber differences to analyze
klim = 40.
kxmin = -klim
kxmax = klim
kymin = -klim
kymax = klim
kstep = klim / 100.

# compute transfer function as a function of wavenumber difference
transff = array_transff_wavenumber(coords, klim, kstep, coordsys='xy')

# plot
plt.pcolor(np.arange(kxmin, kxmax + kstep * 1.1, kstep) - kstep / 2.,
           np.arange(kymin, kymax + kstep * 1.1, kstep) - kstep / 2.,
           transff.T, cmap=obspy_sequential)

plt.colorbar()
plt.clim(vmin=0., vmax=1.)
plt.xlim(kxmin, kxmax)
plt.ylim(kymin, kymax)
plt.show()
(Source code, png)