Beachball Plot
The following lines show how to create a graphical representation of a focal mechanism.
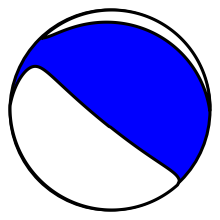
from obspy.imaging.beachball import beachball
mt = [0.91, -0.89, -0.02, 1.78, -1.55, 0.47]
beachball(mt, size=200, linewidth=2, facecolor='b')
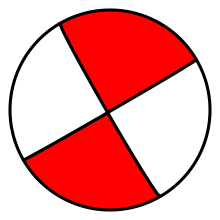
mt2 = [150, 87, 1]
beachball(mt2, size=200, linewidth=2, facecolor='r')
mt3 = [-2.39, 1.04, 1.35, 0.57, -2.94, -0.94]
beachball(mt3, size=200, linewidth=2, facecolor='g')

