Seismogram Envelopes
The following script shows how to filter a seismogram and plot it together with its envelope.
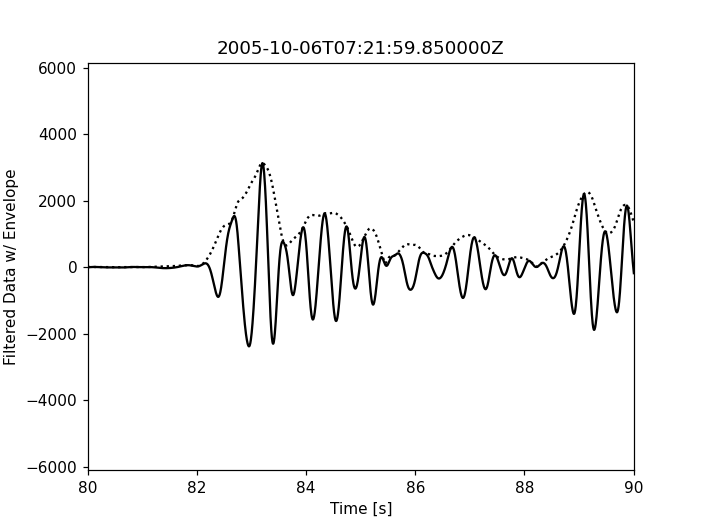
This example uses a zero-phase-shift bandpass to filter the data with corner frequencies 1 and 3 Hz, using 2 corners (two runs due to zero-phase option, thus 4 corners overall). Then we calculate the envelope and plot it together with the Trace. Data can be found here.
import numpy as np
import matplotlib.pyplot as plt

import obspy
import obspy.signal


st = obspy.read("https://examples.obspy.org/RJOB_061005_072159.ehz.new")
data = st[0].data
npts = st[0].stats.npts
samprate = st[0].stats.sampling_rate

# Filtering the Stream object
st_filt = st.copy()
st_filt.filter('bandpass', freqmin=1, freqmax=3, corners=2, zerophase=True)

# Envelope of filtered data
data_envelope = obspy.signal.filter.envelope(st_filt[0].data)

# The plotting, plain matplotlib
t = np.arange(0, npts / samprate, 1 / samprate)
plt.plot(t, st_filt[0].data, 'k')
plt.plot(t, data_envelope, 'k:')
plt.title(st[0].stats.starttime)
plt.ylabel('Filtered Data w/ Envelope')
plt.xlabel('Time [s]')
plt.xlim(80, 90)
plt.show()
(Source code, png)