Reading Seismograms
Seismograms of various formats (e.g. SAC, MiniSEED, GSE2, SEISAN, Q, etc.) can
be imported into a Stream object using the
read() function.
Streams are list-like objects which
contain multiple Trace objects, i.e.
gap-less continuous time series and related header/meta information.
Each Trace object has a attribute called data
pointing to a NumPy ndarray of
the actual time series and the attribute stats which contains all meta
information in a dictionary-like Stats object. Both
attributes starttime and endtime of the
Stats object are
UTCDateTime objects.
The following example demonstrates how a single GSE2-formatted seismogram file
is read into a ObsPy Stream object. There exists
only one Trace in the given seismogram:
>>> from obspy import read
>>> st = read('http://examples.obspy.org/RJOB_061005_072159.ehz.new')
>>> print(st)
1 Trace(s) in Stream:
.RJOB..Z | 2005-10-06T07:21:59.849998Z - 2005-10-06T07:24:59.844998Z | 200.0 Hz, 36000 samples
>>> len(st)
1
>>> tr = st[0]  # assign first and only trace to new variable
>>> print(tr)
.RJOB..Z | 2005-10-06T07:21:59.849998Z - 2005-10-06T07:24:59.844998Z | 200.0 Hz, 36000 samples
Accessing Meta Data
Seismogram meta data, data describing the actual waveform data, are accessed
via the stats keyword on each Trace:
>>> print(tr.stats)
         network:
         station: RJOB
        location:
         channel: Z
       starttime: 2005-10-06T07:21:59.849998Z
         endtime: 2005-10-06T07:24:59.844998Z
   sampling_rate: 200.0
           delta: 0.005
            npts: 36000
           calib: 0.0948999971151
         _format: GSE2
            gse2: AttribDict({'instype': '      ', 'datatype': 'CM6', 'hang': -1.0, 'auxid': 'RJOB', 'vang': -1.0, 'calper': 1.0})
>>> tr.stats.station
'RJOB'
>>> tr.stats.gse2.datatype
'CM6'
Accessing Waveform Data
The actual waveform data may be retrieved via the data keyword on each
Trace:
>>> tr.data
array([-38,  12,  -4, ..., -14,  -3,  -9])
>>> tr.data[0:3]
array([-38,  12,  -4])
>>> len(tr)
36000
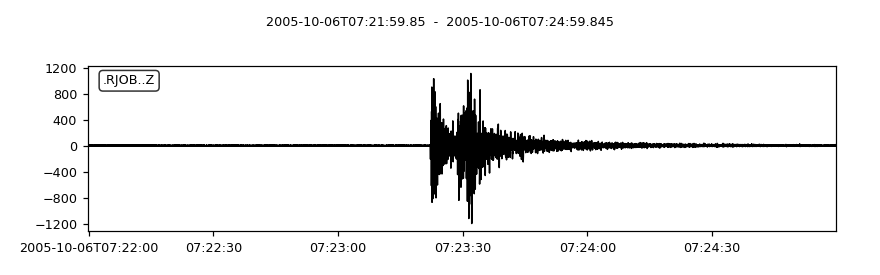
Data Preview
Stream objects offer a
plot() method for fast
preview of the waveform (requires the obspy.imaging module):
>>> st.plot()
(Source code, png)