Hierarchical Clustering
An implementation of hierarchical clustering is provided in the SciPy
package. Among other things, it allows to build clusters from similarity
matrices and make dendrogram plots. The following example shows how to do this
for an already computed similarity matrix. The similarity data are computed
from events in an area with induced seismicity (using the cross-correlation
routines in obspy.signal) and can be fetched from our
examples webserver:
First, we import the necessary modules and load the data stored on our webserver:
>>> import io, urllib
>>> import numpy as np
>>> import matplotlib.pyplot as plt
>>> from scipy.cluster import hierarchy
>>> from scipy.spatial import distance
>>>
>>> url = "https://examples.obspy.org/dissimilarities.npz"
>>> with io.BytesIO(urllib.urlopen(url).read()) as fh, np.load(fh) as data:
...     dissimilarity = data['dissimilarity']
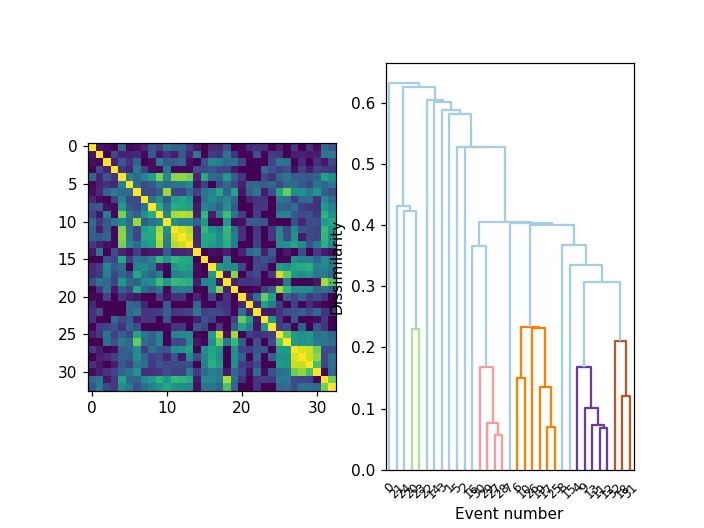
Now, we can start building up the plots. First, we plot the dissimilarity matrix:
>>> plt.subplot(121)
>>> plt.imshow(1 - dissimilarity, interpolation="nearest")
After that, we use SciPy to build up and plot the dendrogram into the right-hand subplot:
>>> dissimilarity = distance.squareform(dissimilarity)
>>> threshold = 0.3
>>> linkage = hierarchy.linkage(dissimilarity, method="single")
>>> clusters = hierarchy.fcluster(linkage, threshold, criterion="distance")
>>>
>>> plt.subplot(122)
>>> hierarchy.dendrogram(linkage, color_threshold=0.3)
>>> plt.xlabel("Event number")
>>> plt.ylabel("Dissimilarity")
>>> plt.show()
(Source code, png)
