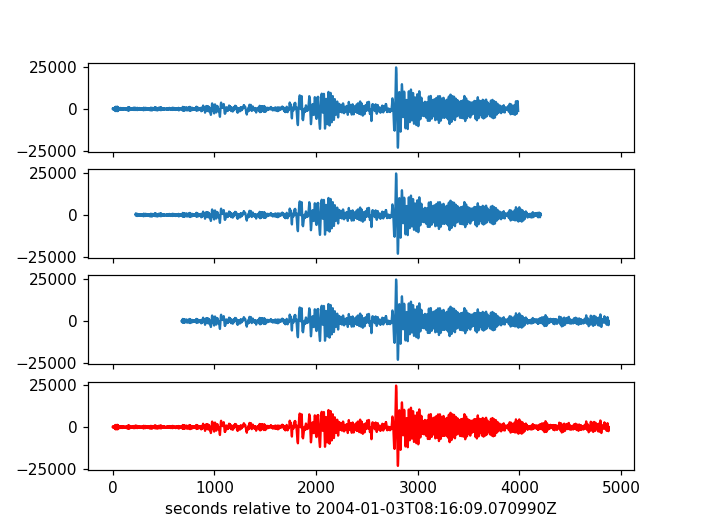
Merging Seismograms
The following example shows how to merge and plot three seismograms with
overlaps, the longest one is taken to be the right one. Please also refer to
the documentation of the merge() method.
import matplotlib.pyplot as plt
import obspy


# Read in all files starting with dis.
st = obspy.read("https://examples.obspy.org/dis.G.SCZ.__.BHE")
st += obspy.read("https://examples.obspy.org/dis.G.SCZ.__.BHE.1")
st += obspy.read("https://examples.obspy.org/dis.G.SCZ.__.BHE.2")

# sort
st.sort(['starttime'])

# use common reference time and have x-Axis as relative time in seconds.
# Another option would be to plot absolute times by using
# Trace.times(type='matplotlib') and letting matplotlib know that x-Axis has
# absolute times, by using ax.xaxis_date() and fig.autofmt_xdate()
t0 = st[0].stats.starttime

# Go through the stream object and plot the data with a shared x axis
fig, axes = plt.subplots(nrows=len(st)+1, sharex=True)
ax = None

for (tr, ax) in zip(st, axes):
    ax.plot(tr.times(reftime=t0), tr.data)

# Merge the data together and plot in a similar way in the bottom Axes
st.merge(method=1)
axes[-1].plot(st[0].times(reftime=t0), st[0].data, 'r')
axes[-1].set_xlabel(f'seconds relative to {t0}')
plt.show()
(Source code, png)