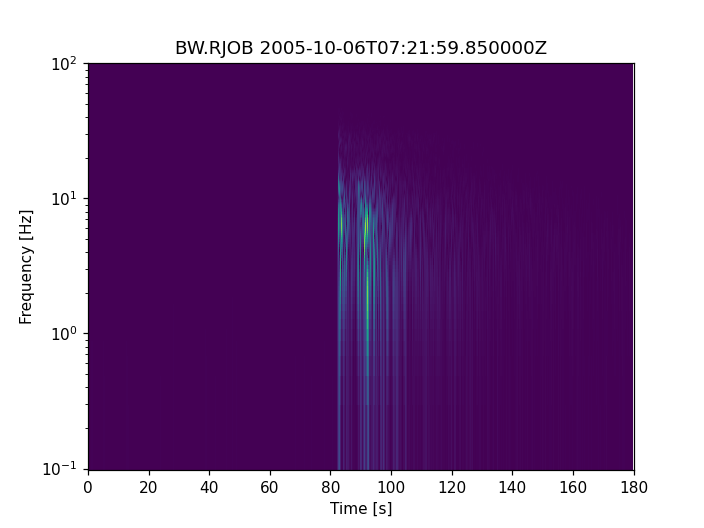
Plotting Spectrograms
The following lines of code demonstrate how to make a spectrogram plot of an
ObsPy Stream object.
Lots of options can be customized, see
spectrogram() for more details. For
example, the colormap of the plot can easily be adjusted by importing a
predefined colormap from matplotlib.cm, nice overviews of available
matplotlib colormaps are given at:
http://www.physics.ox.ac.uk/users/msshin/science/code/matplotlib_cm/
http://matplotlib.org/examples/color/colormaps_reference.html
import obspy

st = obspy.read("https://examples.obspy.org/RJOB_061005_072159.ehz.new")
st.spectrogram(log=True, title='BW.RJOB ' + str(st[0].stats.starttime))
(Source code, png)
